


According to Vidyesh Swar, who specializes in the packaging industry. His research about the reusable smart packaging market indicates that the market has several growth opportunities. The global reusable smart packaging market size was estimated at USD 2.64 billion in 2025 and is expected to grow at a CAGR of 9% during the forecast period. The market is projected to reach approximately USD 6.25 billion by 2035. Factors like real-time asset tracking, better product protection, and optimization of warehouse operations drive the growth. Major players like IFCO Systems, Avery Dennison, and Mondi Group support growth.
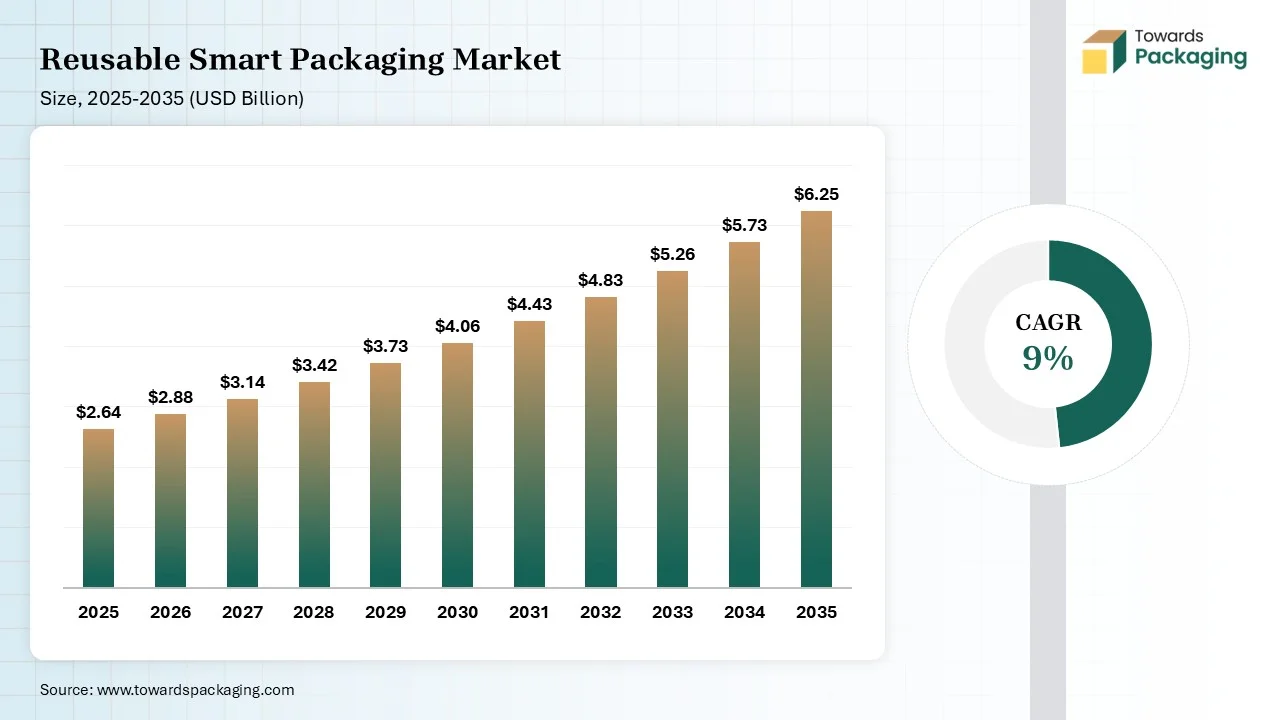
Reusable smart packaging is packaging made for multiple uses that integrates digital technology. Technologies like NFC chips, IoT sensors, digital watermarks, RFID tags, QR codes, or electronic labels are used in reusable smart packaging. Its features are condition monitoring, high durability, interactive interfaces, digital tracking, and dynamic displays. Materials like PP, advanced textiles, indicator chemicals, glass, polymer labels, and conductive nanomaterials are required. It offers benefits like less waste, real-time tracking, supply chain visibility, and resource conservation. The global reusable smart packaging market size was estimated at USD 2.64 billion in 2025. The increased embedding of QR codes, eco-conscious younger demographics, expansion of reusable formats in companies, rising adoption of returnable packaging architectures, and waste-reduction practices drive growth in 2025. Companies like Amcor, DS Smith, Schoeller Allibert, Sealed Air, and ORBIS Corporation are major contributors.
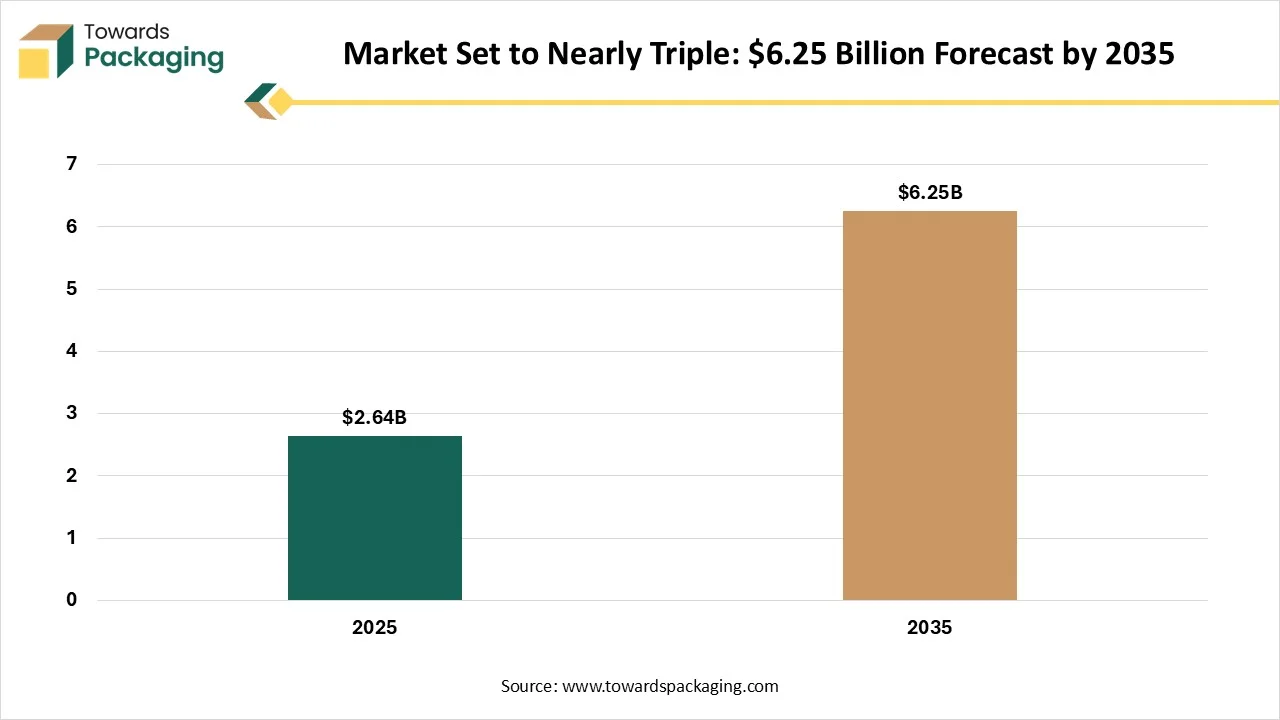
The market is expected to reach $6.25B by 2035. Factors include adoption of reusable formats, sensor integration, advancing reverse logistics, expanding AI-driven inventory, growing cost efficiency of smart containers, expanding smart refill ecosystem, incorporation of IoT, focus on zero-waste models, rise in stainless-steel composites, incorporation of cloud analytics, requirement for trackable packaging, and green brands acceleration. Companies like Avery Dennison Corporation, Scholler Allibert, Amcor plc, and ORBIS Corporation will contribute to the growth.
The reusable smart packaging reached $2.64B in 2025 and is expected to reach $6.25B through 2035. The market is expanding faster due to mandatory circularity regulations, integration of real-time tracking, focus on long-term cost savings, priority to waste reduction, growing demand for condition monitoring sensors, and online logistics scaling. Technology providers like BASF SE, Avery Dennison Corporation, and 3M Company help with growth.
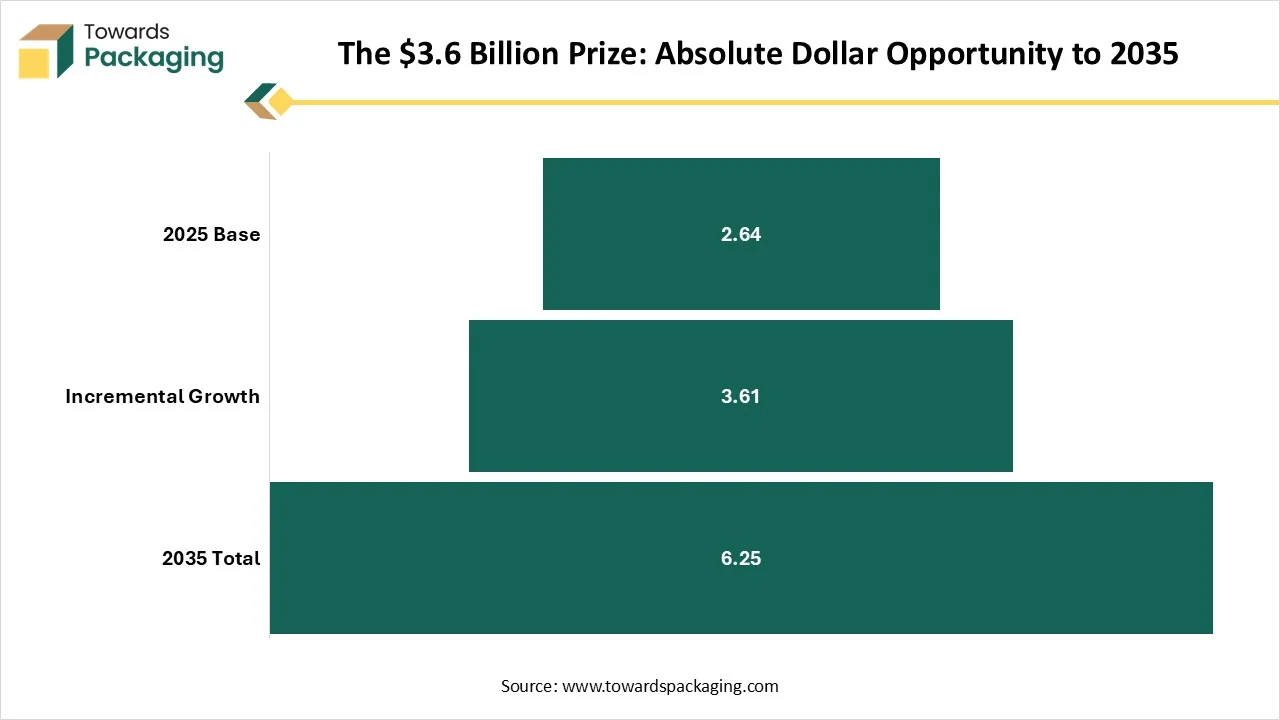
The incremental value of the market is 3.61B in the period of 2025 to 2035. The market growth drivers are robust government frameworks, companies' adoption of verifiable green metrics, demand for tracking container location, need to monitor temperature-sensitive pharmaceuticals, expanding unit-level tracking, focus on compatibility of warehouse automation, interest in predictive reverse logistics, expansion of pooling networks, increased accounting of carbon footprint, and demand for anti-counterfeiting serialization.
Source:- Towards Packaging Database
EU PPWR regulation was created by the European Union, and it replaced the 1994 directive in all member states. The regulation came into effect on 11 February 2025. The key goals of the regulation are waste reduction and direct uniformity. On 12 August 2026, the regulation came into application. In August 2026, the regulation focuses on reuse systems, conformity documentation, direct applicability, and packaging design. Targets related to minimum recycled content and recyclability will be applicable in January 2030. Recyclability rules are empty space limits and minimization. The expanded reuse targets will be applicable by 2040. In January 2040, it focuses on escalating reuse quotas and waste reduction.
Source:- European Commission, Packaging and Packaging Waste Regulation (Regulation (EU) 2025/40); Berlin Packaging regulatory summary (2025)
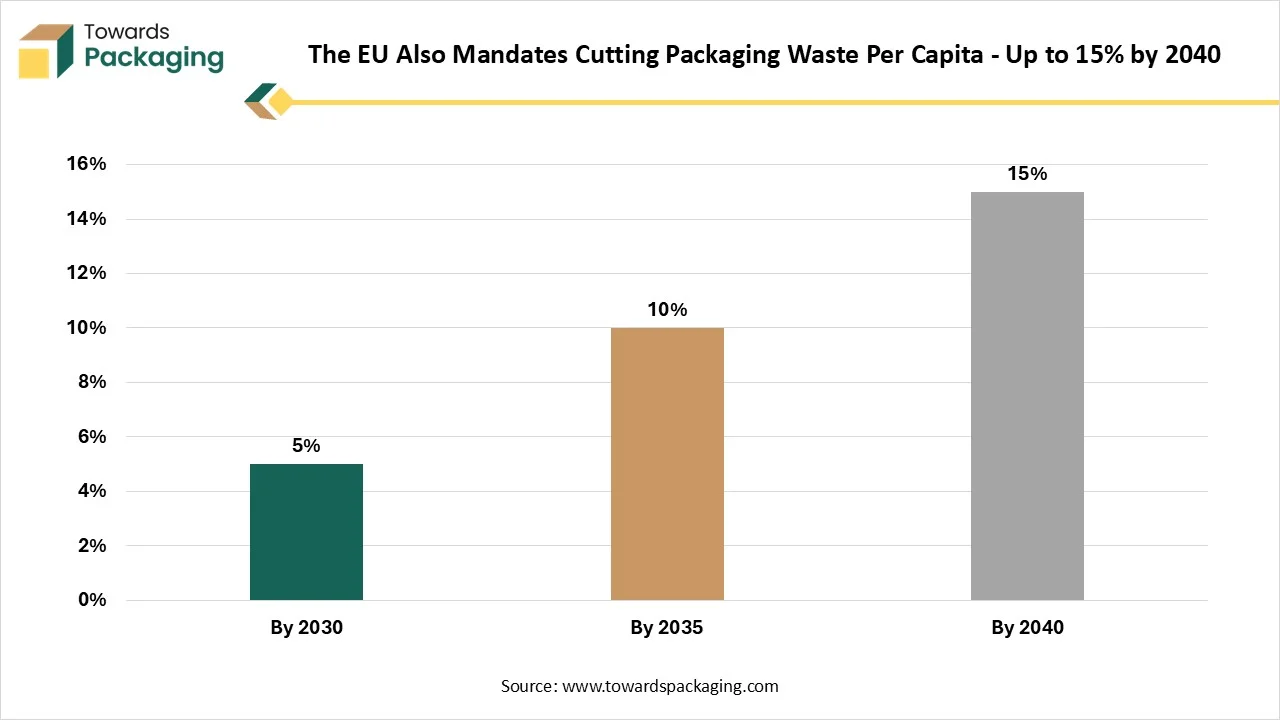
EU mandates declare a reduction of packaging waste by 5% by 2023. The reduction targets are decided with 2018 levels. The key targets in 2030 are mandatory recyclability, single-use bans, waste reduction, and minimization rules. EU PPWR declares a reduction of packaging waste by 10% by 2025. The targets in 2035 include material minimization, per capita waste reduction, and scaling recycling. By 2040, the EU declares a per capita packaging waste reduction of 15%. In 2040, targets are utilization of refill & reuse quotas, uniform compliance, and bans on redundant formats.
Source:- European Commission PPWR, Article 43; Greif regulatory summary (2025)
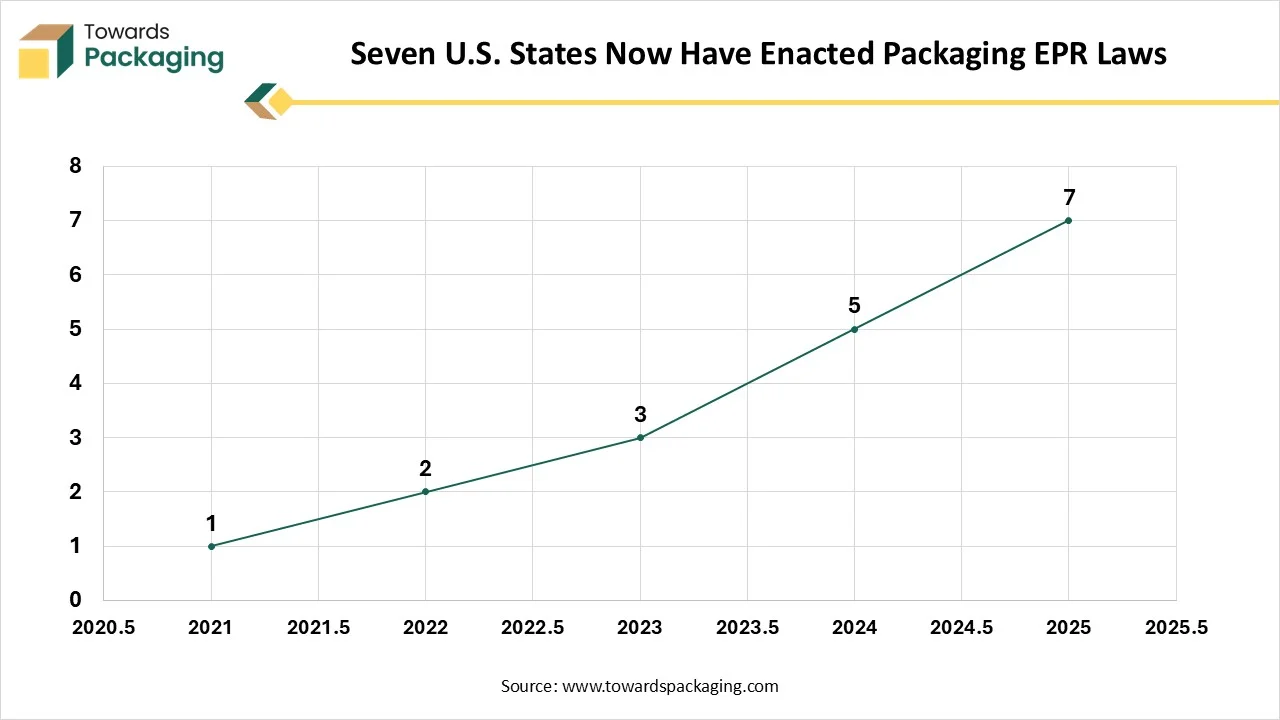
In 2021, one state across the United States adopted packaging EPR laws. In 2022, two states adopted packaging EPR laws. States enacted laws are Colorado and California. Three states of the U.S. enacted packaging EPR laws in 2024. States like Maryland and Connecticut adopted laws. In 2024, five states adopted EPR laws, and some states include New Jersey, Minnesota, & California. In 2025, a total of seven states enacted packaging EPR laws across the United States. Seven states include Maine, Colorado, Minnesota, Washington, California, Maryland, and Oregon. In 2025, 10 states, including New York, Tennessee, Illinois, Rhode Island, New Hampshire, New Jersey, Massachusetts, Hawaii, North Carolina, and Wisconsin, reintroduced EPR legislation.
Source:- Proskauer Rose LLP, 'Seven States and Counting' (October 2025); Amcor U.S. State EPR Guide (2025)
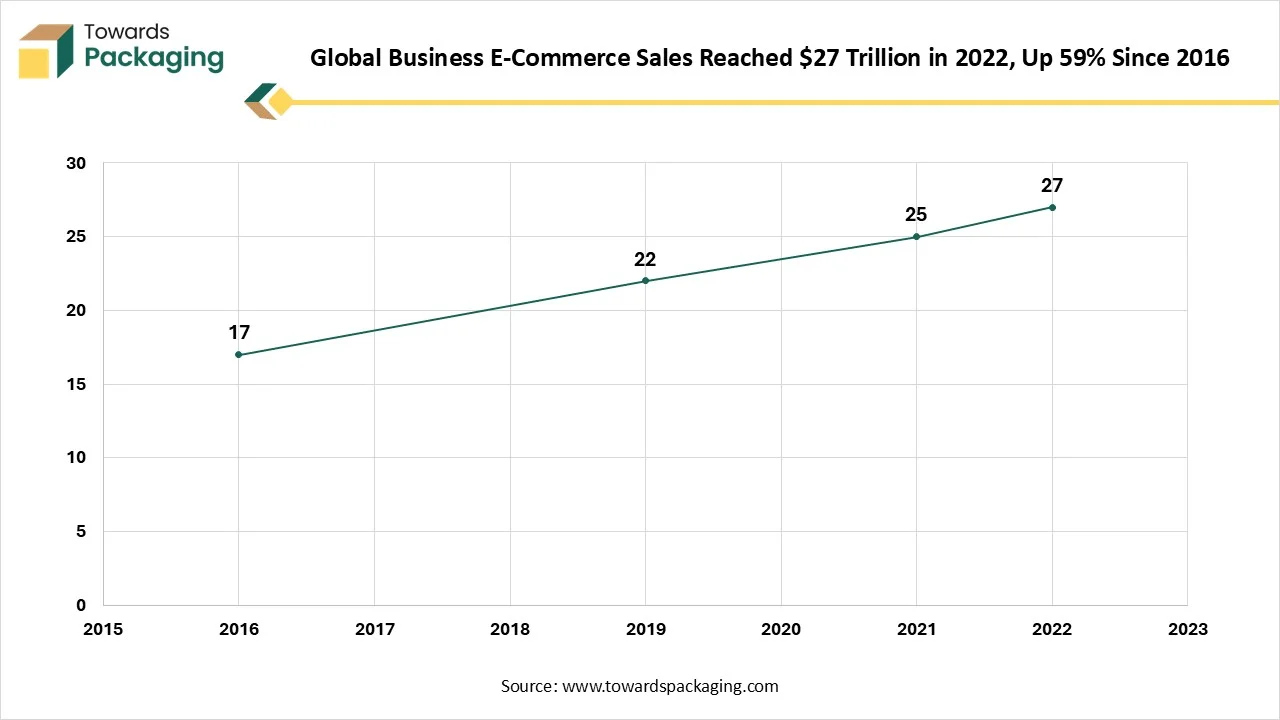
Business e-commerce sales grew from $17T to $27T from 2016 to 2022 across 43 economies. Business e-commerce sales reached $17T in 2016. Business e-commerce sales were $22T in 2019. Business e-commerce sales reached $25T in 2021, and in 2022 they reached $27T. The e-commerce sales grew by 59% over the period. The sales were driven by factors like lockdowns, faster shipping demand, availability of fast mobile internet, expansion of digital marketplaces, digital payments, and high smartphone use. Platforms like Alibaba and Amazon are major contributors to the market.
Source:- UNCTAD, 'Business E-Commerce Sales and the Role of Online Platforms' (2024)
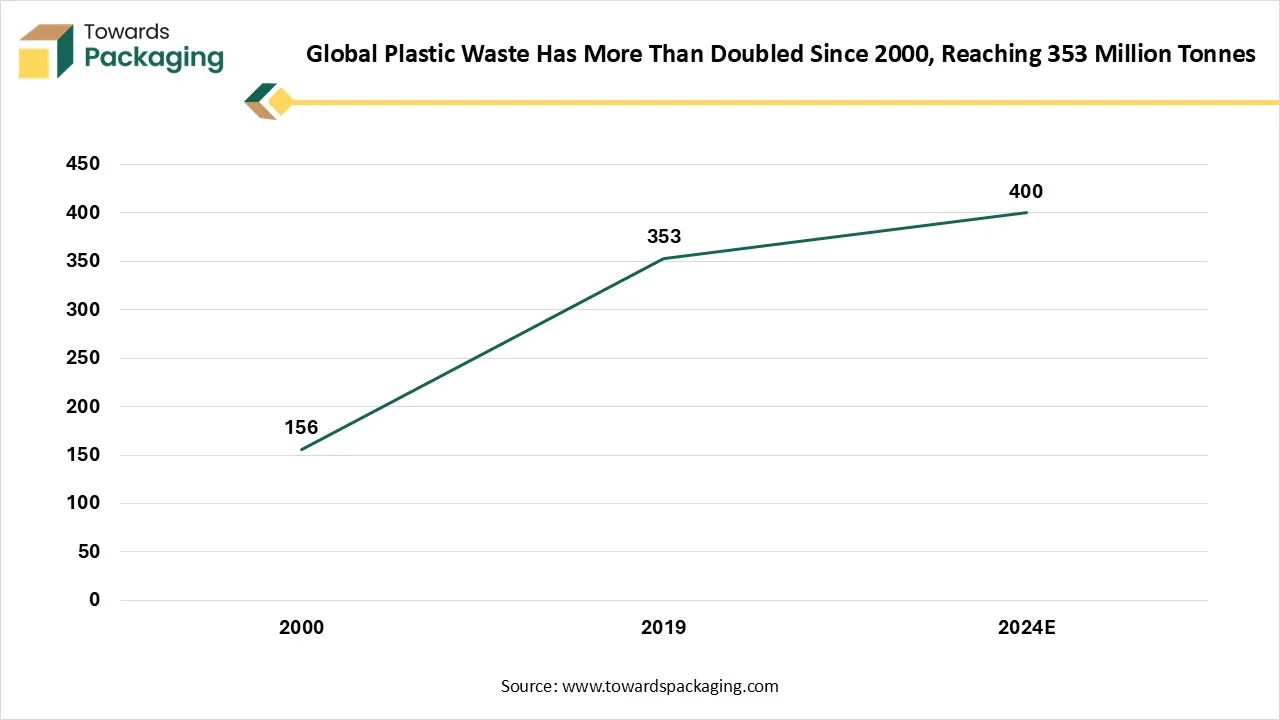
Packaging waste more than doubled in 2024 compared to 2000. Global packaging waste generated in 2000 was 156 million tonnes. The packaging waste includes glass, wood, paper, plastics, metals, paperboard, and other materials. The total packaging waste generated in 2019 was 353MT and it mainly includes plastic, wood, paper, glass, metal, & cardboard. The total plastic waste is projected to reach approximately 400MT in 2024. In 2019, only 9% of packaging waste was recycled. The rate is low due to factors like complex materials, lack of infrastructure, and export restrictions.
Source:- OECD, 'Global Plastics Outlook: Economic Drivers, Environmental Impacts and Policy Options' (2022)
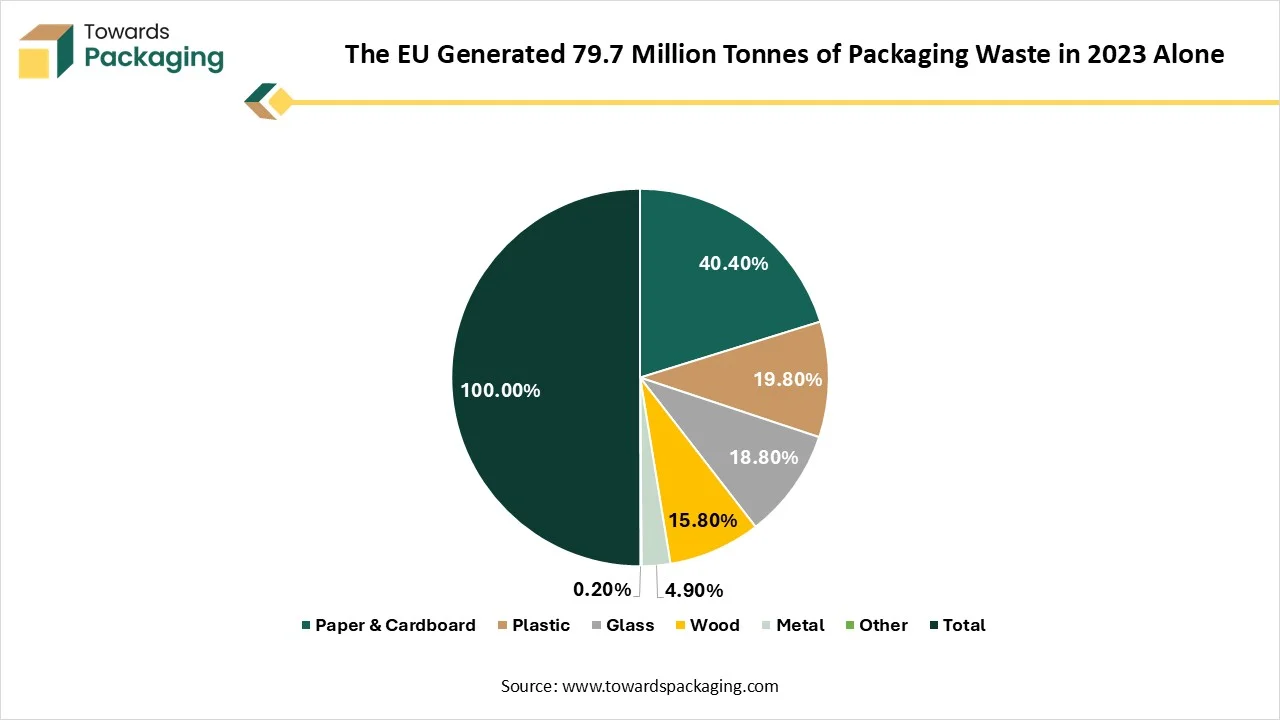
In 2023, total packaging waste generated across the European Union was 79.7 million tonnes. Paper & cardboard held a 40.4% share in 2023. Plastic held a 19.8% share in 2023. Glass held an 18.8% share in 2023. Wood held a 15.8% share in 2023. Metal held a 4.9% share in 2023, and other materials held a 0.2% share. Paper & cardboard reached 32.3MT, plastic reached 15.8MT, glass reached 15MT, wood reached 12.6MT, metal reached 3.9MT, and other reached 0.2MT in 2023. Paper & cardboard held the highest share due to bulk material utilization, sorting ease, e-commerce, and plastic bans.
Source:- Eurostat, 'Packaging Waste Statistics' (extracted 10 October 2025)
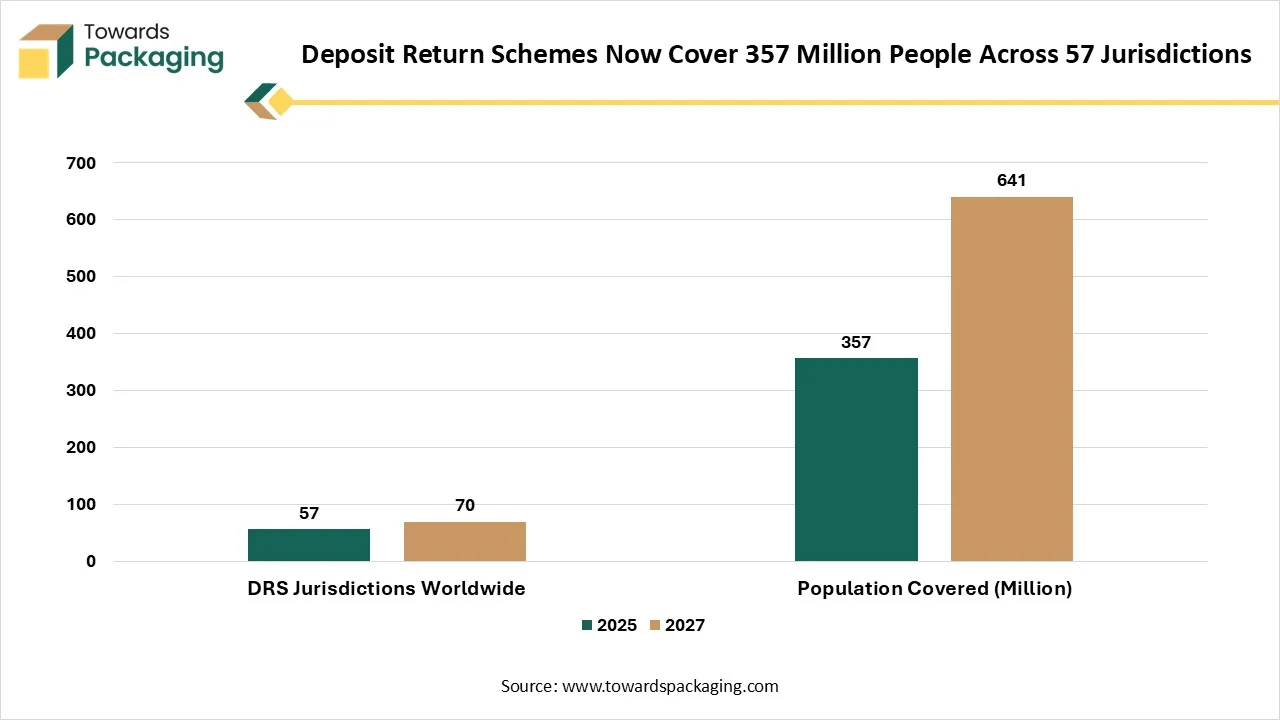
In 2025, a total of 357 million people live in 57 active DRS jurisdictions globally. Europe has 20 DRS systems, and North America includes 10. The fully operational DRS are present across countries like Germany, Denmark, Finland, Lithuania, Iceland, Norway, Sweden, Estonia, Croatia, and the Netherlands. It is projected to reach 70 DRS jurisdictions by the end of 2027. It is projected to cover approximately 641 million people. Countries like India and the United Kingdom launched DRS in their states. DRS focuses on meeting stringent recycling targets.
Source:- Reloop Platform, 'Global Deposit Book' (2025 edition)
Total operational DRS present across 16 European Union countries as of 1 September 2025. Some countries are Austria, Finland, the Netherlands, Denmark, Latvia, Norway, Germany, Ireland, Sweden, Estonia, Lithuania, and many more. Four countries are preparing for the implementation of DRS. These four countries adopted regulations. 7 countries do not have a DRS ecosystem. Countries like France, Belgium, Poland, Cyprus, Spain, Italy, and Greece currently don’t have DRS systems.
Source:- Peer-reviewed study, MDPI Sustainability journal, citing PPWR (2024) and national DRS status (2025)
According to Aman’s research, the Ellen MacArthur Foundation Global Commitment was introduced in 2018. The company included over 1200 organization. Organizations like governments, key global brands, & others are included. These organizations cover 20% of global plastic packaging waste. The lag in reusable packaging is showcased in the 2024 progress report. The report highlights recyclability gaps, growth of recycled content, virgin plastic reduction, and shortfall of reusable packaging.
Source:- Ellen MacArthur Foundation, 'The Global Commitment 2025' progress overview; Packaging Dive coverage (2024/2025)
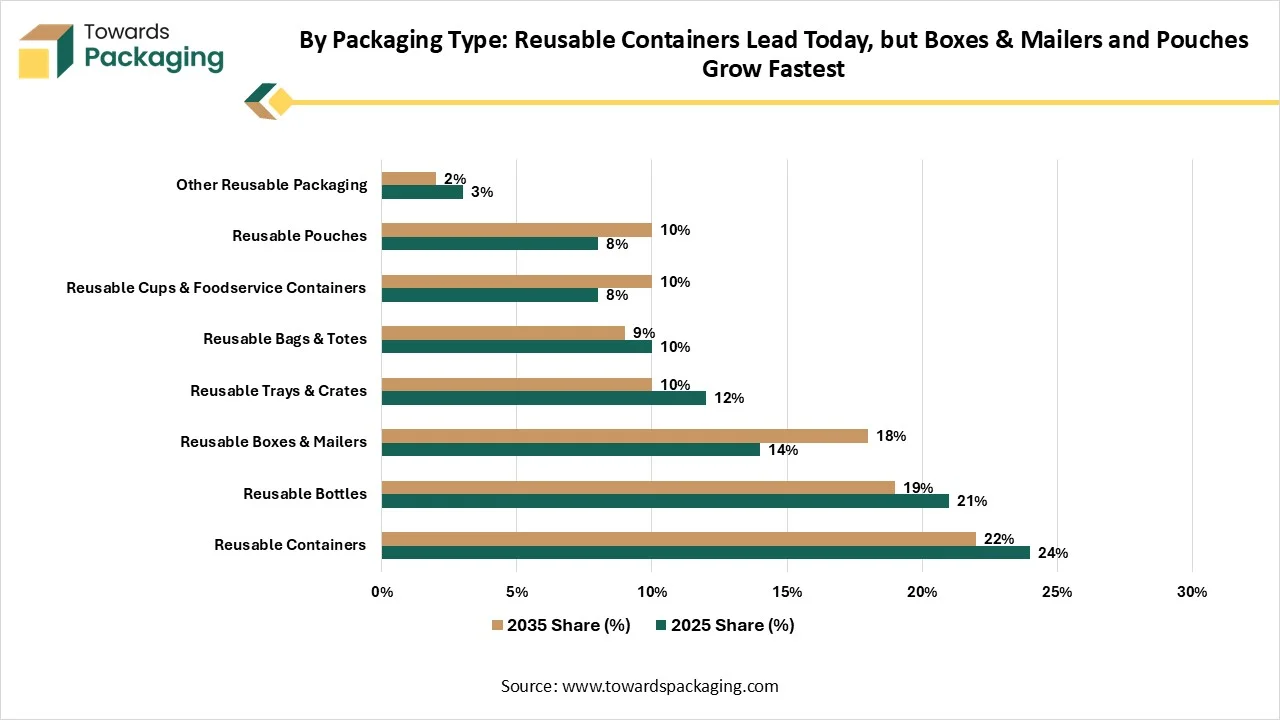
Packaging type comprises reusable containers, reusable boxes & mailers, reusable bags & totes, reusable pouches, reusable bottles, reusable trays & crates, reusable cups & foodservice containers, and other reusable packaging. Reusable containers dominated the reusable smart packaging market with a 24% share in 2025. The focus on preventing crushing of items and maximizing cargo space increases demand for reusable containers. The lower expenses and IoT integration in reusable containers help with expansion. The automation friendliness, cost reduction, and space saving of reusable containers drive the growth. Reusable boxes & mailers are expected to grow with the fastest CAGR of 11.8% during the forecast period. The high cardboard waste production and focus on automating return loops increase the use of reusable boxes & mailers. The focus on lowering packaging expenditure and focus on less product damage increases the use of reusable boxes & mailers. The incorporation of digital e-ink displays supports the growth. Reusable bottles held a 21% market share in 2025. Brands' preference for reusable packaging and the rise in rejecting single-use plastics increase adoption of reusable bottles. BFA-free materials demand and fitness trends increase use of reusable bottles. The integration of Bluetooth technology in reusable bottles boosts growth.
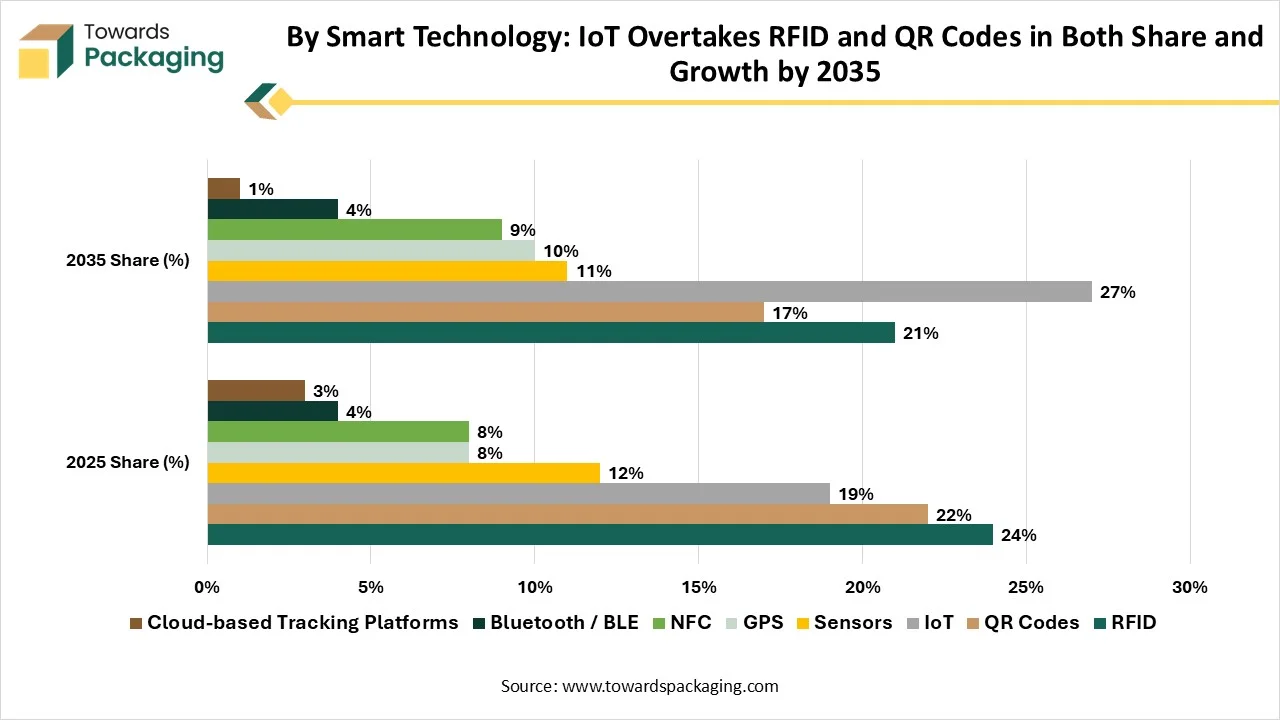
RFID dominated the reusable smart packaging industry with a 24% share in 2025. The bulk buying of containers and focus on exact usage cycles increase the use of RFID. The demand for asset visibility and lower shrinkage increases the use of RFID. The bulk scanning, lifecycle durability, rotation counts, and unique serial numbers of RFID help with the growth. QR codes held a 22% market share in 2025. The focus on personal waste reduction and the need to avoid specialized app downloading increases adoption of QR codes. The dynamic updating of content and demand for live updates increases use of QR codes. The low price, easy inventory control, and lifecycle tracking in QR codes support the growth. IoT is expected to grow with the fastest CAGR of 12.8% during the forecast period. The tracking of expensive pallets and prevention of theft increases the use of IoT. The focus on inventory accuracy and the need to monitor environmental conditions increases the use of IoT. Factors like verification of sanitation, optimization of routes, billing automation, and asset recovery increase the use of IoT.
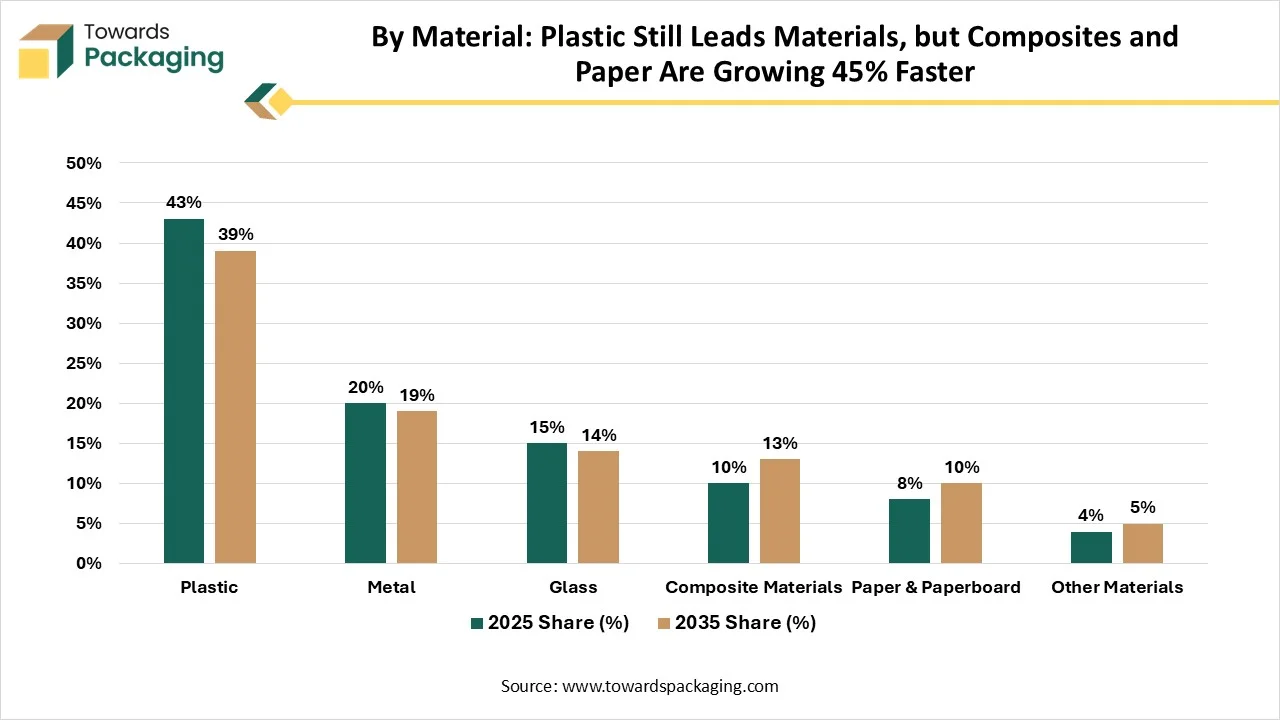
Plastic dominated the reusable smart packaging market with a 43% share in 2025. The demand for inexpensive packaging raw materials and the need to lower return transit fuel increases demand for plastic. The high sensor compatibility and design flexibility in plastics help with expansion. The smart technology compatibility with plastic boosts growth. Metal held a 20% market share in 2025. The material breakage prevention and monitoring freshness across industries increase use of metal. Governments' demand for the utilization of reusable systems and the rise in BPA-free coatings help with growth. Composite materials are expected to grow with the fastest CAGR of 11.7% during the forecast period. The minimization of operational expenses and focus on monitoring high-quality goods increases the use of composite materials. The IoT tracking incorporation, long life, exceptional corrosion resistance, and strong sensor protection in composite materials supports the growth.
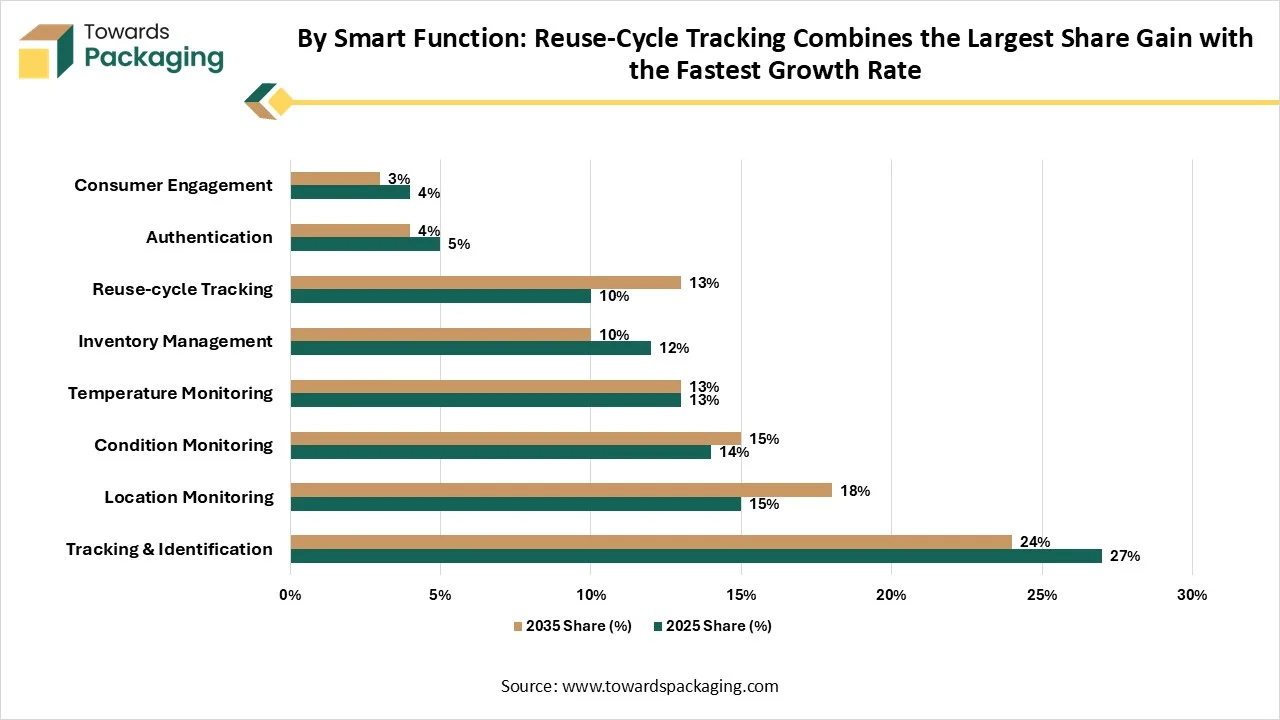
Tracking & identification dominated the reusable smart packaging industry with a 27% share in 2025. Consumer demand for tracking the exact location of products and the avoidance of misplacing items increases the use of tracking & identification. The continuous condition monitoring and acceleration of sorting in warehouses increases the use of tracking & identification. Better rotation, data security, and loss prevention in tracking & identification drive the growth. Reuse-cycle tracking is expected to grow with the fastest CAGR of 11.7% during the forecast period. The focus on preventing loss of high-value containers and EPR focus on reuse rates increases the use of reuse-cycle tracking. The acceleration of inventory turnaround and lifecycle optimization uses reuse-cycle tracking. The incorporation of cloud analytics and BLE tags in reuse-cycle tracking supports growth. Location monitoring held a 15% market share in 2025. The focus on shrinking losses and demand for digital circulation proof increases use of location monitoring. The focus on minimizing replacement cost, avoiding delivery delays, cutting fuel waste, and verifying handling conditions increases use of location monitoring, supporting the growth.
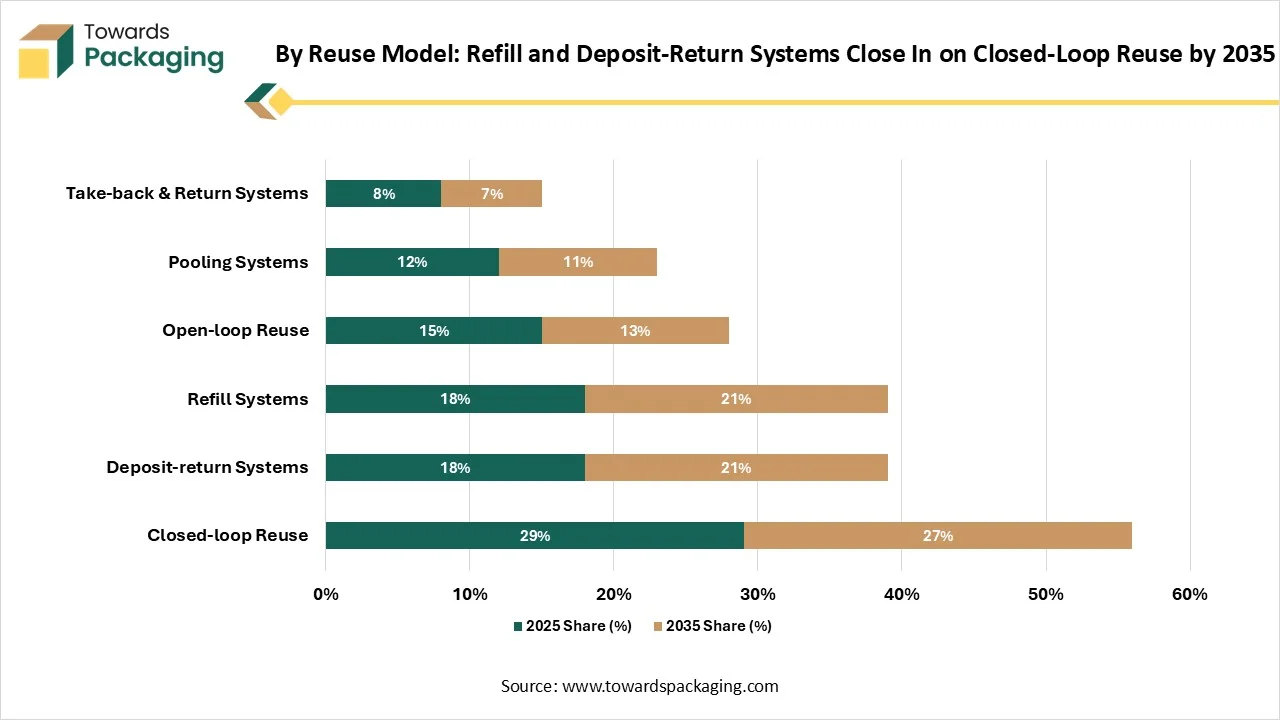
Closed-loop reuse dominated the reusable smart packaging market with a 29% share in 2025. The focus on complete lifecycle visibility and creation of predictable reverse logistics increases the use of closed-loop reuse. Reduction of continuous disposal and simplification of routine cleaning increase the use of closed-loop reuse. The high recovery rates, controlled hygiene, and optimized inventory in closed-loop reuse drive the growth. Deposit-return systems held an 18% market share in 2025. The increased sending of containers back to providers and focus on cutting material spending increase the use of deposit-return systems. The cost amortization, high return efficiency, and regulatory pressures in deposit-return systems drive the growth. Refill systems are expected to grow with the fastest CAGR of 10.8% during the forecast period. The need to lower idle inventory and material volume reduction increases the use of refill systems. The high use of refillable household goods and preference for refill-at-home increases demand for refill systems.
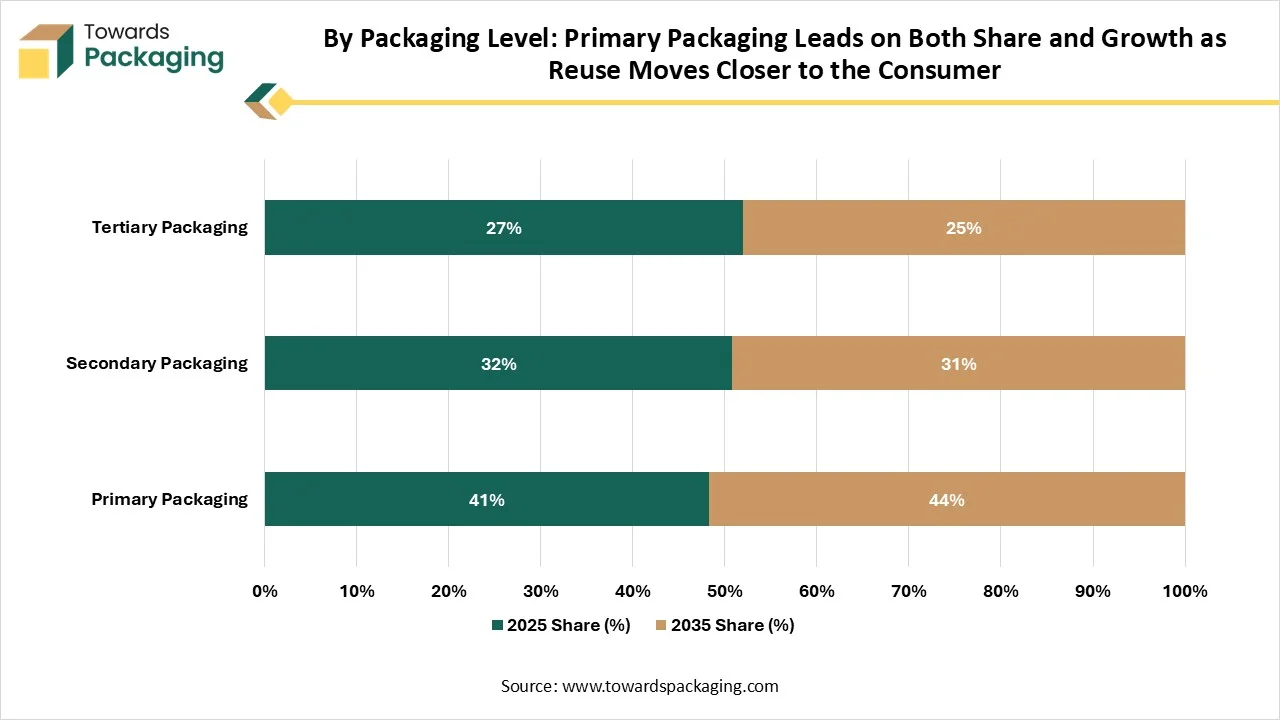
Primary packaging dominated with a 41% share in 2025 and is expected to grow with the fastest CAGR of 9.8% during the forecast period. The focus on direct product connection and tracing items through supply chains increases the use of primary packaging. The focus on satisfying safety laws and demand for lowering spoilage in food increases the use of primary packaging. The high use in drug tracking supports the growth. Secondary packaging held a 32% market share in 2025. The easy integration of secondary packaging with IoT tags helps in condition tracking, supporting growth. The replacement of disposable goods and minimization of product crushing increases the use of secondary packaging. The low regulatory barriers support growth. Tertiary packaging held a 27% market share in 2025. The integration of tertiary packaging with automated warehouse sorting helps with expansion. The lower bulk expenses, optimized cargo space, and prevention of misplacement of bulk assets increase the use of tertiary packaging.
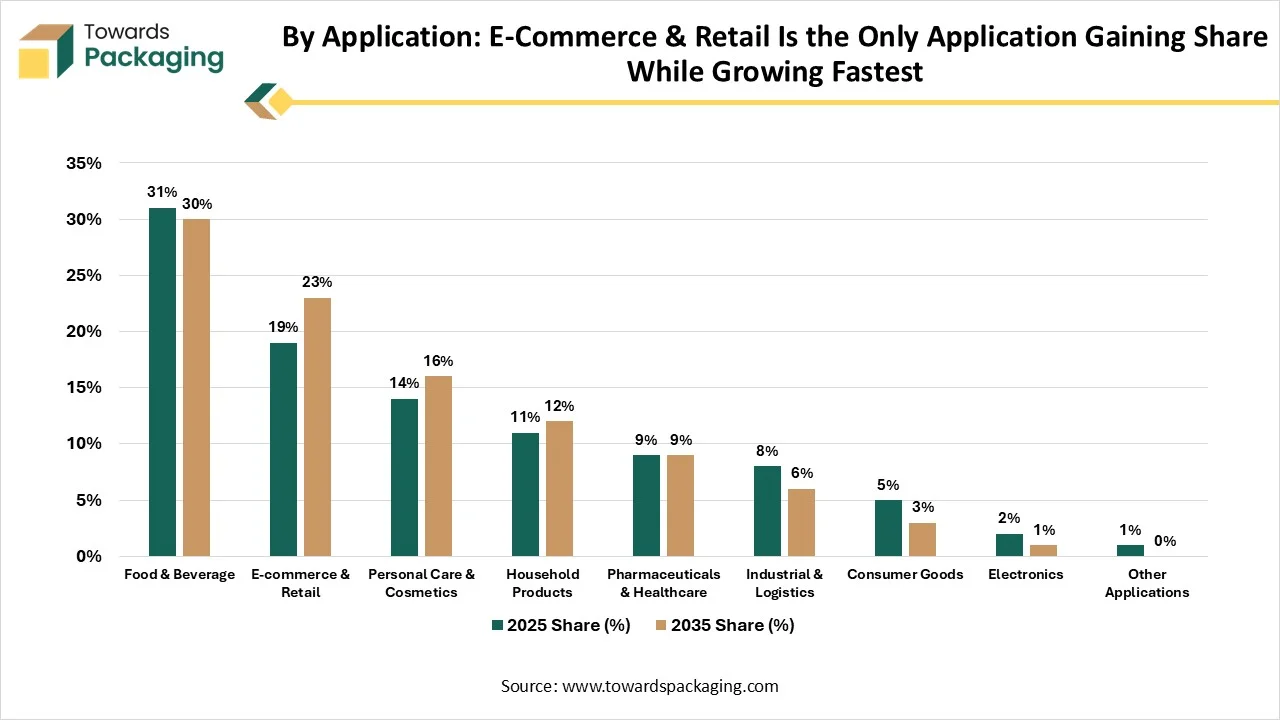
Food & Beverage leads the reusable smart packaging market with a 31% share in 2025. The focus on evaluating real-time food product conditions and requirements for instant safety verification increases the use of reusable smart packaging. The real-time temperature tracking of food and the transition of daily consumable goods increase the use of reusable smart packaging. The demand for precise inventory control drives the growth. E-commerce & retail is expected to grow with a 10.9% CAGR during the forecast period. The high plastic waste in online shopping and growing preference for green brands increase the use of reusable smart packaging. The focus on increasing repeat buying rates and the need for seamless reverse logistics supports the overall growth. Personal care & cosmetics held a 14% market share in 2025. The use of refillable compacts in personal care and the rise in authenticity checks increase the use of reusable smart packaging. The focus on preventing degradation of skincare ingredients and the rise in customized skin tutorials increase the use of reusable smart packaging, helping the growth.
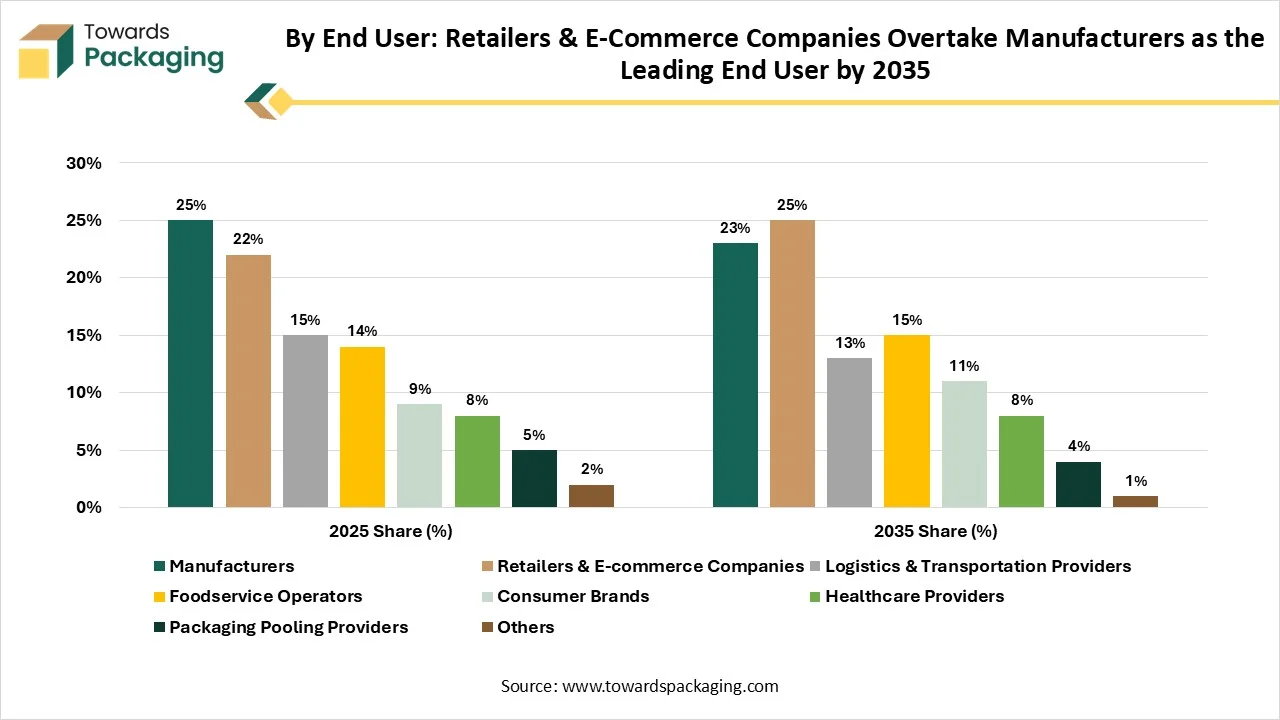
Manufacturers dominated the reusable smart packaging industry with a 25% share in 2025. The growth in reusable smart containers and the protection of expensive industrial products increases the use of reusable smart packaging. Asset loss reduction and automation fit help with expansion. The focus on high-volume savings drives the growth. Retailers & e-commerce companies held a 22% share in 2025. The focus on embracing circular models and interest in live tracking in the retail industry increases the use of reusable smart packaging. The demand for foldable containers in e-commerce and the rise in brand loyalty programs increase the use of reusable smart packaging. Consumer brands are expected to grow with the fastest CAGR of 11% during the forecast period. The introduction of EPR in consumer brands and focus on monitoring user returns increases the use of reusable smart packaging. The focus on connecting buyers to brand apps and the shift to returnable models increases adoption of reusable smart packaging. The rise in verification of product origin boosts growth.
Source:- Towards Packaging Database
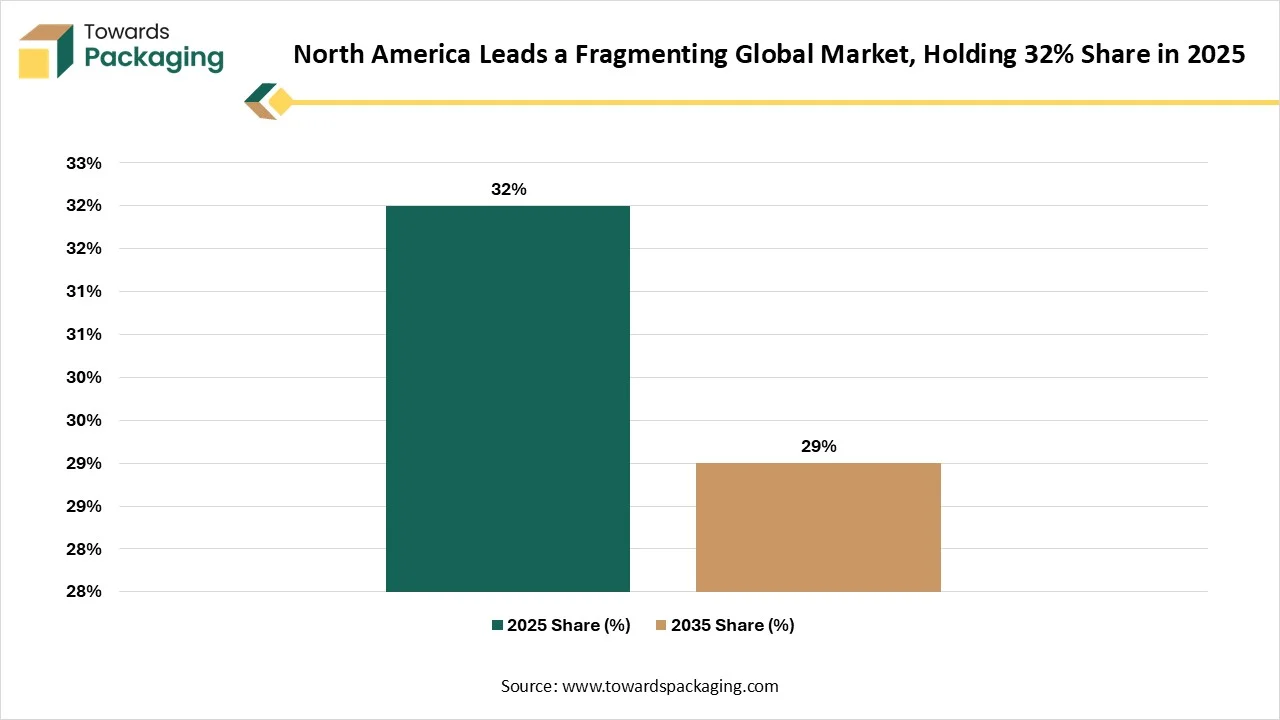
North America dominated the reusable smart packaging market with a 32% share in 2025. The growing requirements for fast shipping and stringent FDA standards increase the use of reusable smart packaging. The strong network for reverse logistics and increased product safety awareness increase the use of reusable smart packaging. The advancements in cold chains and expansion of smart manufacturing facilities drive the market growth. United States held the largest share in the North American region. The demand for real-time location tracking and the need for trackable transit units increase adoption of reusable smart packaging. The stringent cold-chain requirements in pharma and optimization of supply chain visibility increase demand for reusable smart packaging. The IoT integration drives the growth.
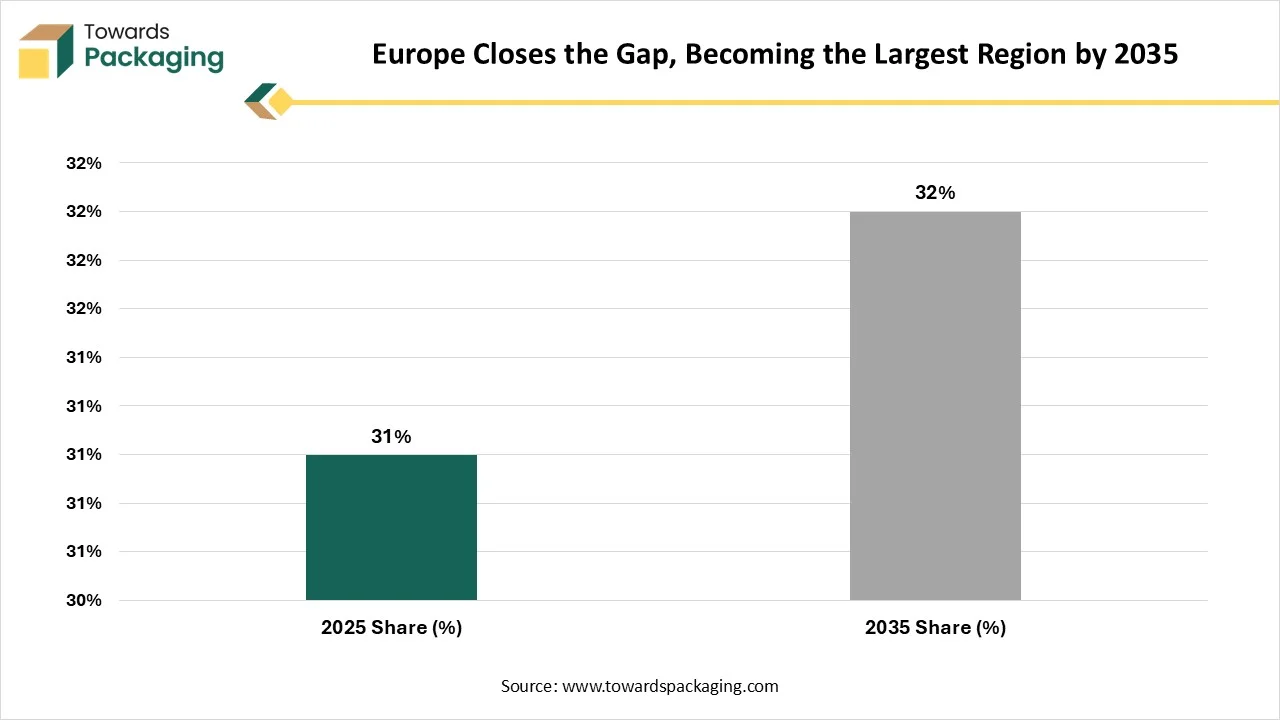
Europe held a 31% market share in 2025. The companies focus on meeting recycling targets, and expansion of Digital Product Passports increases the use of reusable smart packaging. The strong asset-pooling networks and transition to closed-loop systems increase the use of reusable smart packaging. The RFID integration and companies' shift to refillable systems drive the growth. France is rapidly expanding in the European region. The presence of AGEC law and penalties on multilayer packaging increases demand for reusable smart packaging. The integration of digital sensors and rise in public-private trials of reusable packaging helps with expansion. The adoption of smart tracking supports the overall growth.
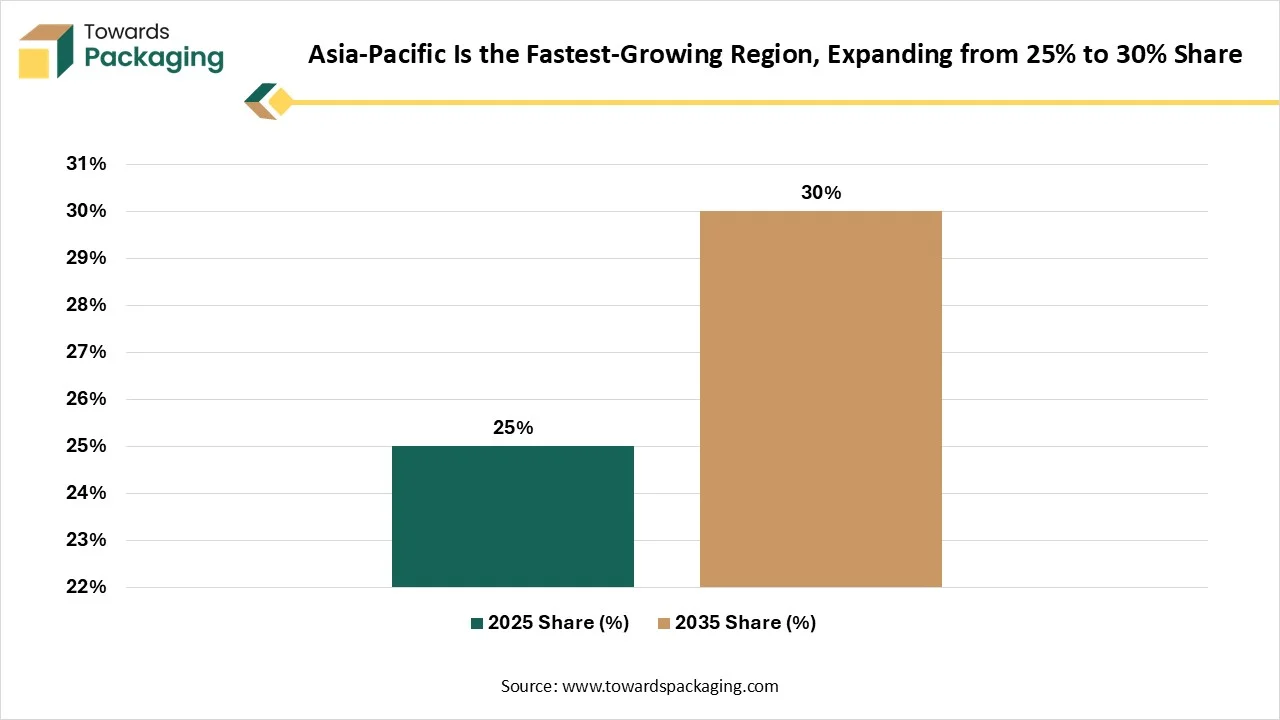
Asia Pacific held a 25% share in the reusable smart packaging market in 2025 and is expected to grow with the fastest CAGR of 10.9% during the forecast period. The use of trackable containers in online retail and the stringent eco-friendly regulations increase demand for reusable smart packaging. The integration of RFID tracking in perishable foods and the presence of returnable smart assets help with expansion. Companies focus on managing return loops, and expansion of advanced sensor-enabled packaging drives the overall growth. India is rapidly expanding in the market. The growing demand for multi-trip containers and development of returnable plastic crates increases the use of smart sensors. The demand for tracking product freshness and integration of QR codes helps with expansion. The interest in real-time authentication supports the growth.
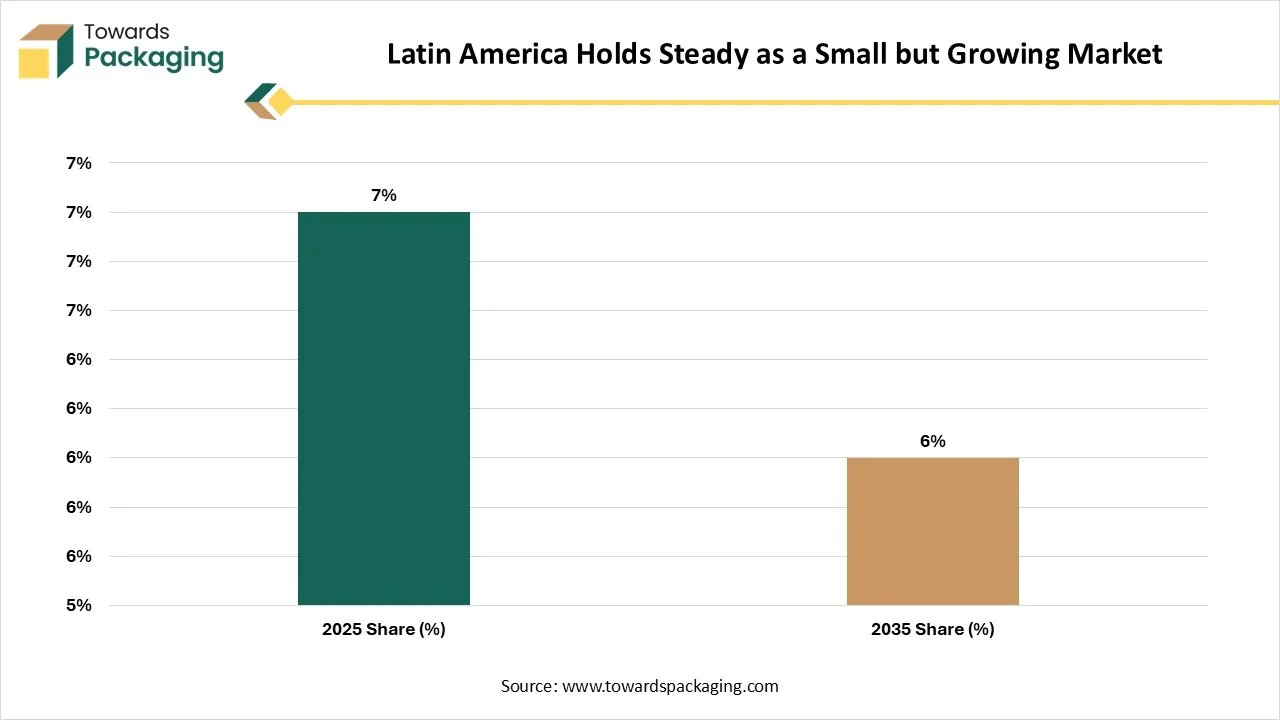
Latin America held a 7% share in the market in 2025. The increased IoT integration in reusable totes and crates helps with expansion. The interest in durable transit packaging and companies' focus on asset management increases the use of reusable smart packaging. The adoption of smart IoT tags in the beverage industry and the expansion of advanced active indicators drive the overall growth. Brazil is a key player in the Latin America region. The demand for tough packaging in online shopping and rising use of smart labels increases adoption of reusable smart packaging. The high utilization of reusable containers in the auto industry and the need to monitor freshness of agri products increases use of reusable smart packaging, supporting the overall growth.
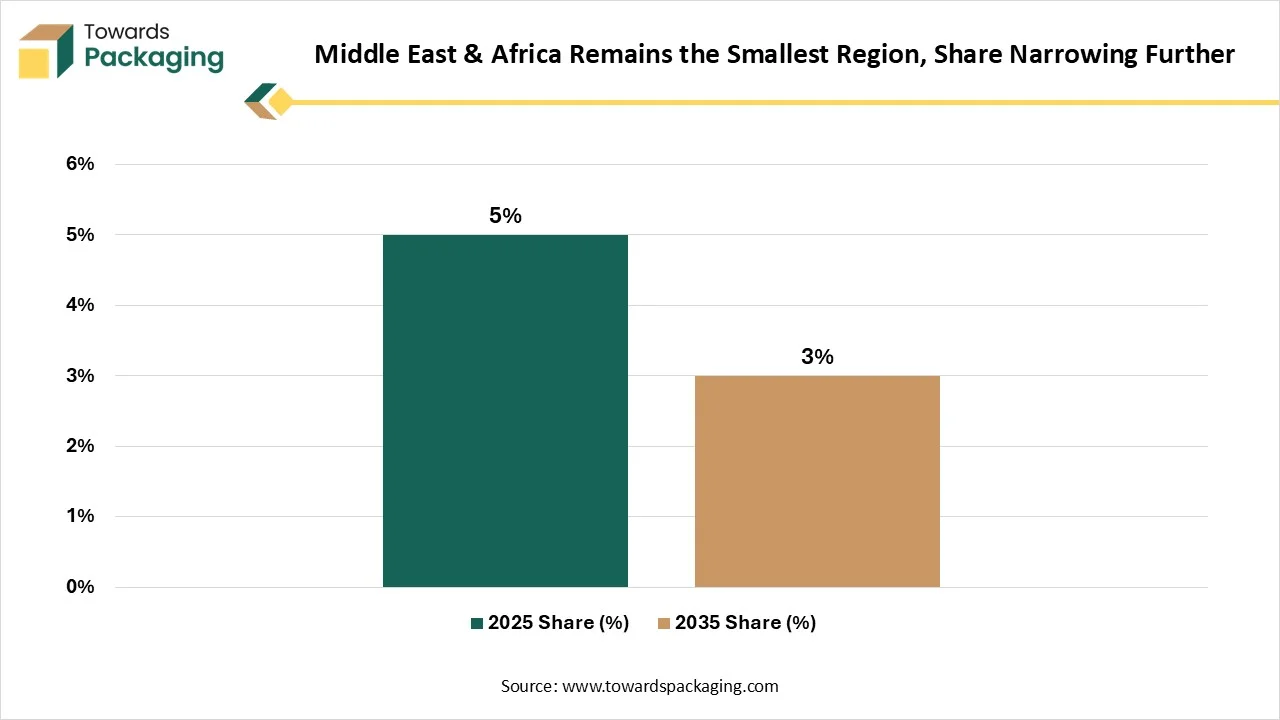
MEA held a 5% Share in the market in 2025. The advancements in sensor-monitored temperature and national strategies for reusable systems increase the use of reusable smart packaging. The focus on blocking fake pharmaceutical products and major trade areas increases the use of reusable smart packaging. The rise in pharma serialization and surging logistics automation drives the growth. UAE is robustly expanding in the market. The rise in industrial recycling loops and surge in durable reusable totes increases integration of smart sensors. Advancements in the pharmaceutical industry and expansion of smart returnable plastic pallets help with the growth.
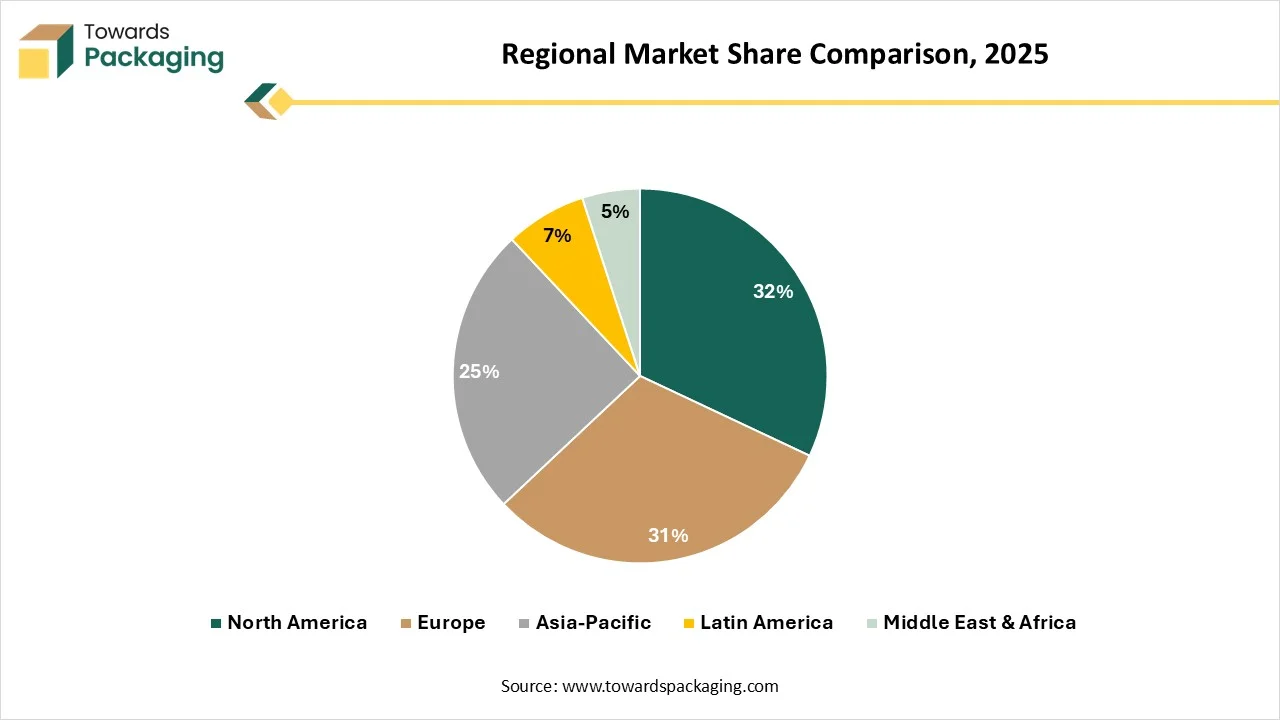
North America held a 32% share in the reusable smart packaging industry in 2025. Factors driving North America's growth are integration of condition-monitoring sensors and high requirements for tamper evidence. Europe held a 31% share in the market in 2025, driven by waste-minimization targets, integration of active tracking features in packaging, and priority to recyclability in Western Europe. Asia Pacific held a 25% share in the market in 2025 due to investment in cold-chain logistics and expansion of reusable sensors. Latin America held a 7% share in the market in 2025 due to focus on better inventory visibility across industries. Middle East & Africa held a 5% share in the market in 2025 due to high capital cost and gaps in return loops.
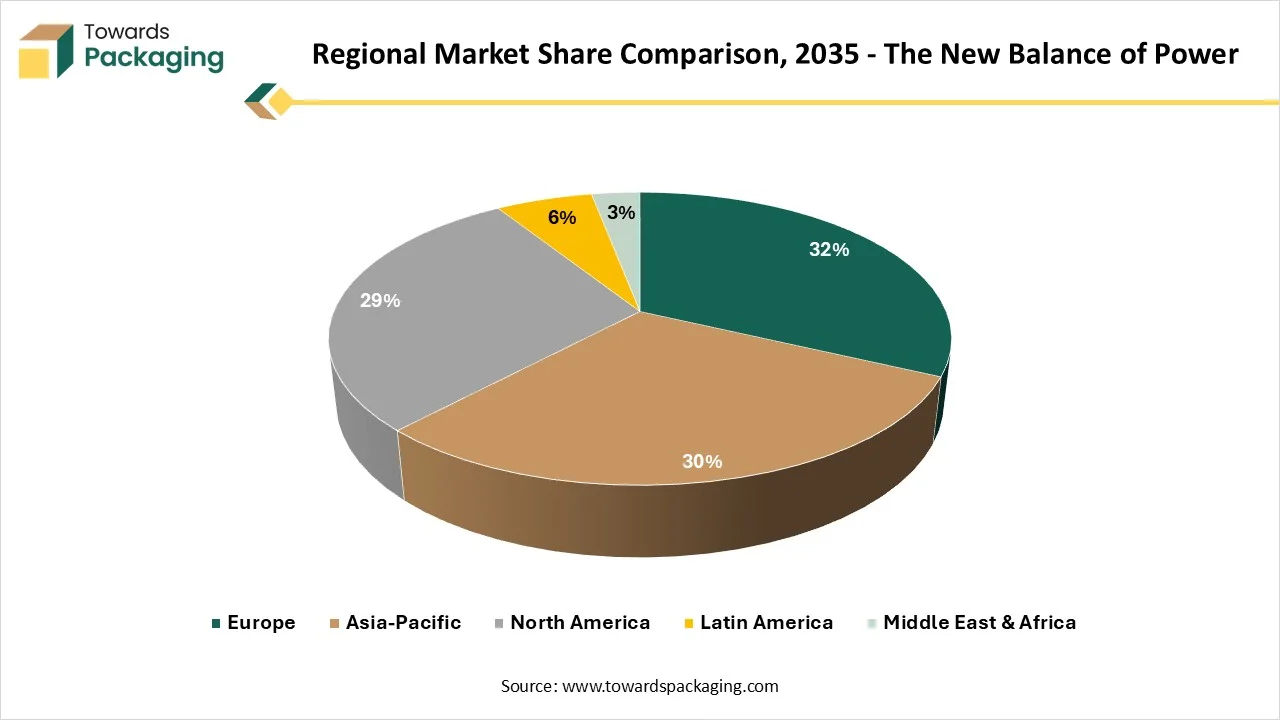
Europe dominates the market with a 32% share by 2035 due to high use of NFC chips and expanded automated reverse logistics. North America holds a 29% share by 2035 due to high integration of QR code tracking. Asia Pacific holds a 30% share in the market by 2035 due to technology integration in the supply chain and expanding returnable containers. Latin America holds a 6% share in the market by 2035 due to low investment in advanced RFID & other sensors and focus on optimization of cost. The Middle East & Africa holds a 3% market share by 2035 due to high capital expenditure and high use of conventional packaging.
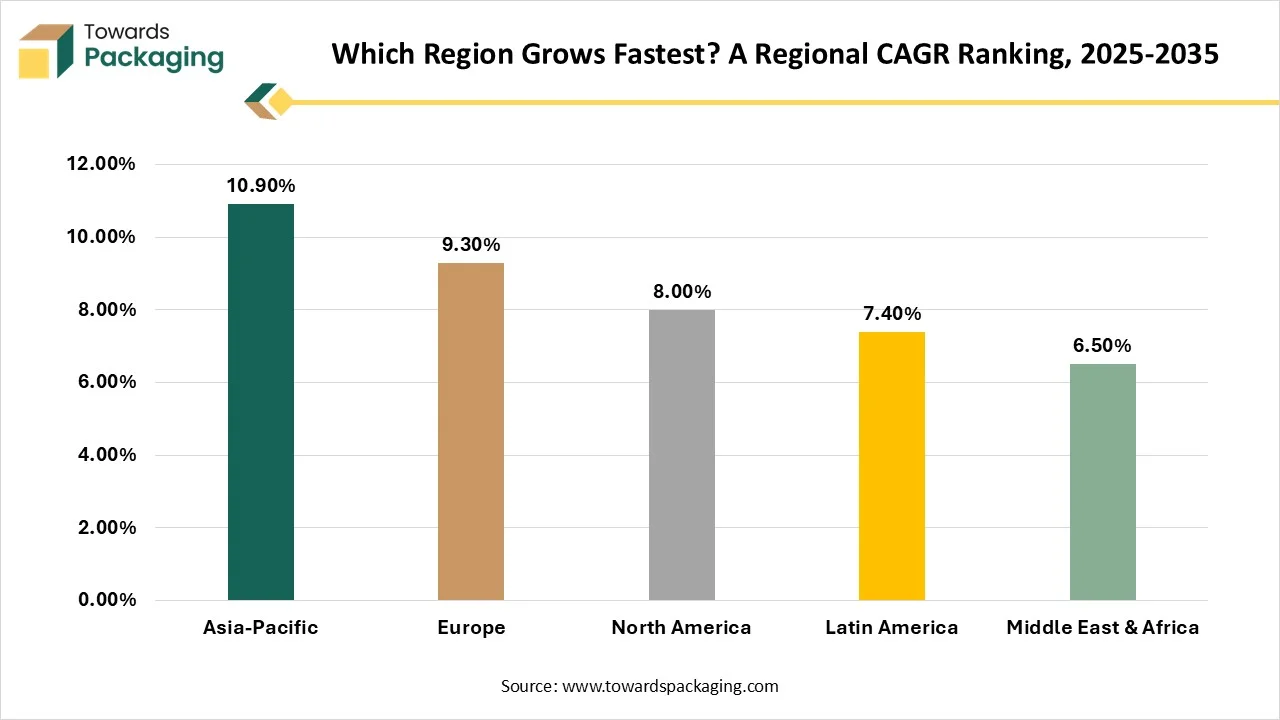
Asia Pacific is expected to grow with the highest CAGR of 10.9% during the forecast period due to massive digital networks and high use of sensor-enabled containers. Europe is expected to grow with a 9.3% CAGR during the forecast period due to the growth in deposit-return systems. North America is expected to grow with an 8% CAGR during the forecast period due to a rise in supply chain tech and smart tracking trends. Latin America is expected to grow with a 7.4% CAGR during the forecast period due to food safety needs and burgeoning e-commerce. MEA is expected to grow with a 6.5% CAGR in the market during the forecast period due to high capital investment and reverse logistics deficits.
Source:- Towards Packaging Database
According to research, the reusable smart packaging market is growing due to the traceability demand, e-commerce, sustainability goals, and regulations. Growth drivers like cold-chain security demand, advancements in logistics, complex online distribution, anti-counterfeiting measures, and eco-conscious lifestyles are expanding the market. Leading players in the market are Mondi, Berry Global, Amcor plc, and SEE. Smart logistics specialists like Schoeller Allibert and DS Smith contribute to growth.
By Packaging Type
By Smart Technology
By Material
By Smart Function
By Reuse Model
By Packaging Level
By Application
By End User
By Region
Client-Supplied Data
Independently Researched Sources































Principal Research Analyst
Vidyesh Swar is a Senior Research Analyst at Towards Packaging, bringing over 4 years of dedicated expertise in market intelligence and strategic analysis across the dynamic world of packaging technologies and solutions.
Learn more about Vidyesh Swar

Reviewed By
Aditi Shivarkar, with 14+ years in packaging market research, specializes in food, beverage, and eco-friendly packaging. She ensures accurate, actionable insights, driving Towards Packaging Analytics & Consulting 's excellence in industry trends and sustainability.
Learn more about Aditi Shivarkar

Reusable Smart Packaging Market
 Table of Content

 Download Sample
 Schedule a Meeting