


The Packaging Industry comprises the materials, formats, technologies, and value-chain participants involved in containing, protecting, preserving, transporting, and presenting goods across every end-use sector - independent of any single material type, format, or application.
"No single estimate is accepted on its own merit. Every market figure is treated as a hypothesis - tested against independent methodologies and published only once those methodologies converge."
Paper, plastics, glass, metal, wood, bio-based materials
Rigid, flexible, labels, closures, smart packaging
Primary and secondary packaging producers
Food, beverage, healthcare, industrial, e-commerce
Upstream resin, pulp, and metal producers
Logistics, recovery, and recycling networks
A single, repeatable research flow underpins every study - from initial industry orientation to a fully triangulated, forecast-ready market estimate. The same flow applies regardless of packaging segment.
Define scope, segments, and participants
Build market size from end-use consumption
Cross-check via capacity and raw material flow
Estimate Market Size from End-Use Consumption
Project the validated base year forward
Independent quality assurance review
Each stage produces an independent data set. None is treated as final until reconciled with the others in the triangulation stage.
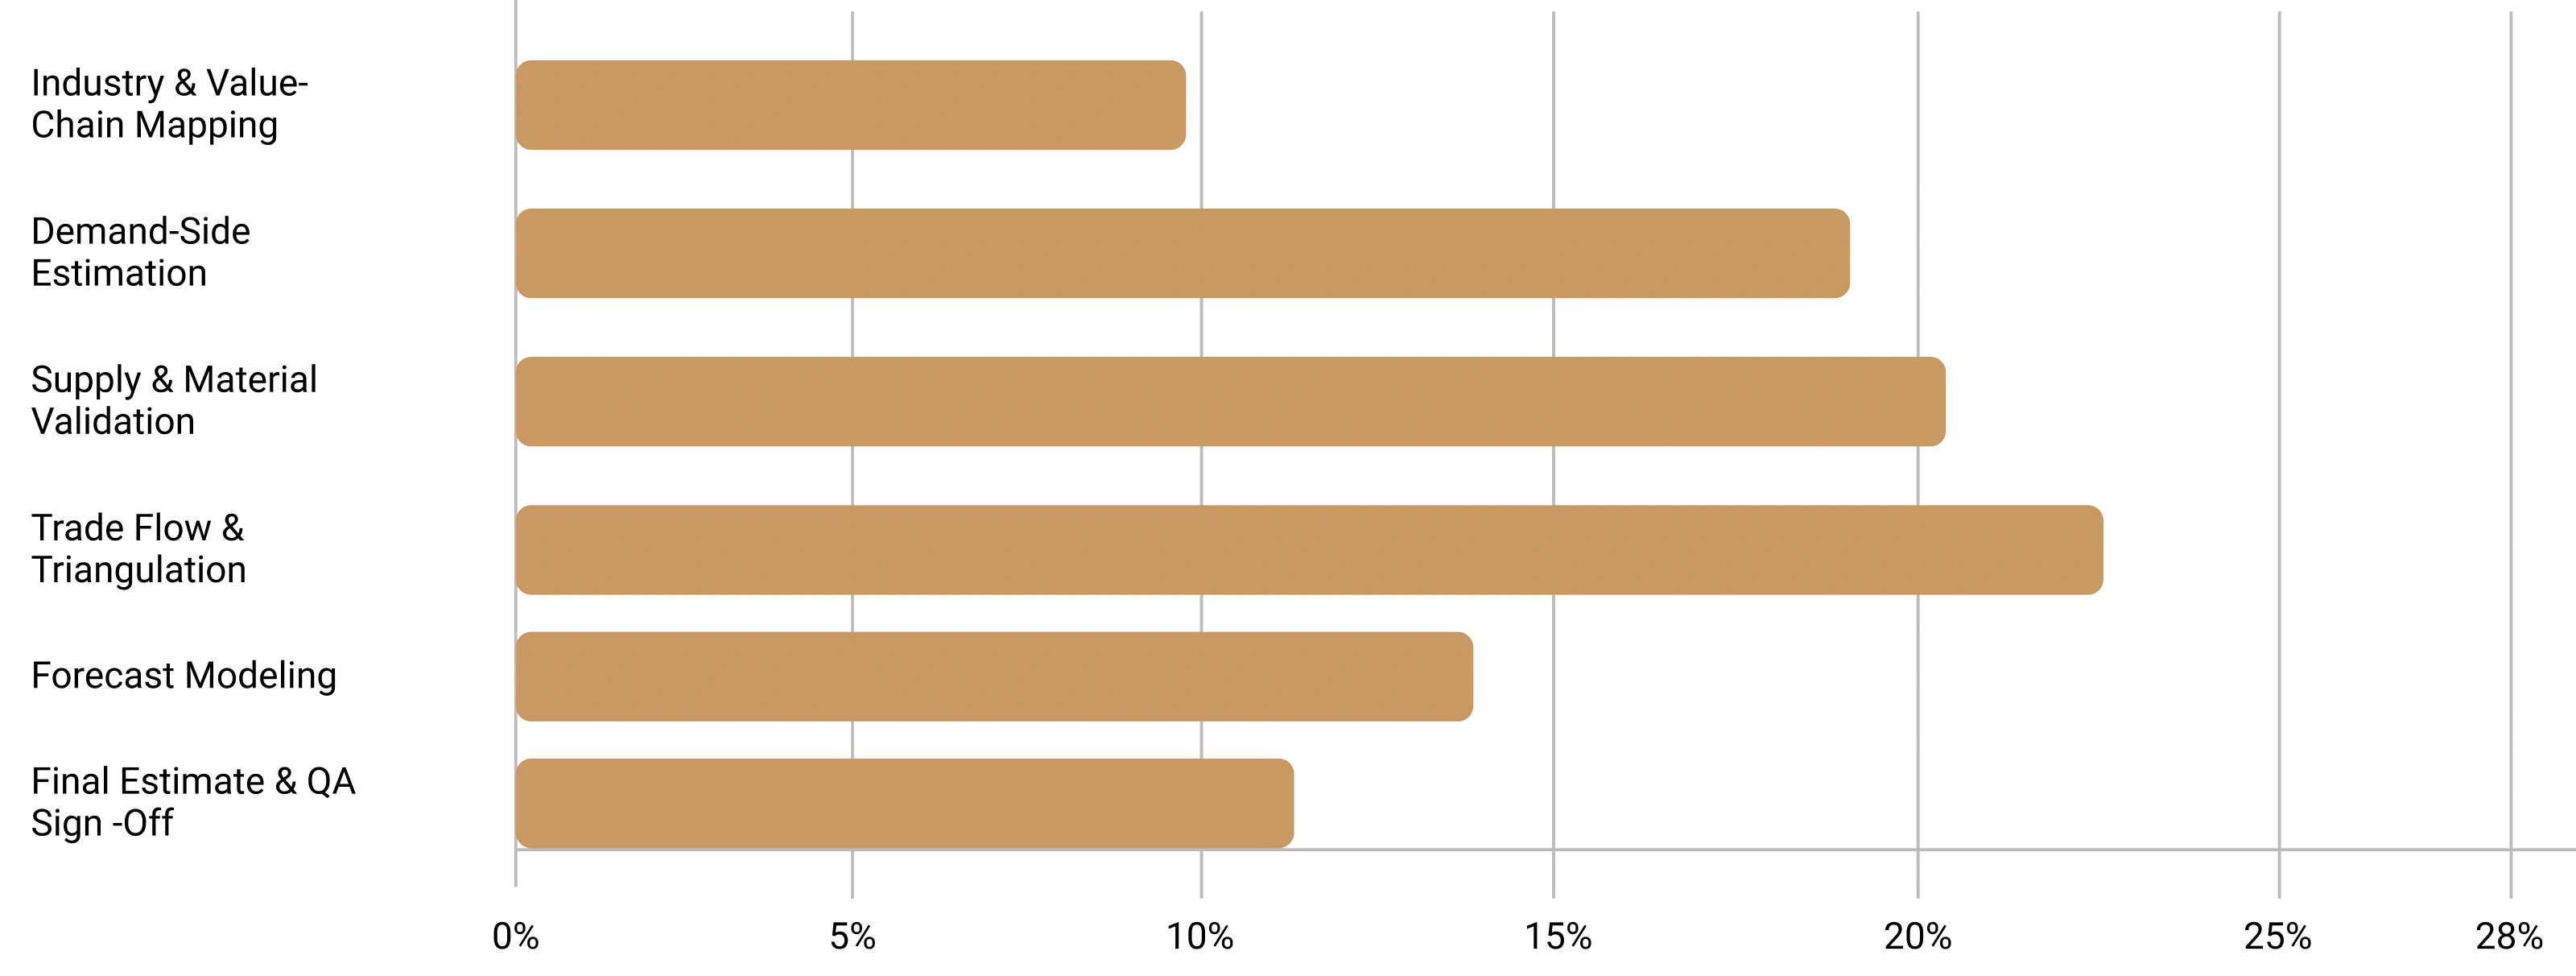
Relative analytical effort allocated across the six research stages
Relying on a single estimation approach leaves a market sizing exercise exposed to that approach's blind spots. Every estimate is therefore built from six independent, cross-checking methodologies. Agreement across all six is the threshold for publication.
Relative analytical strength of each methodology across five key dimensions

Identify every end-use sector that consumes packaged goods – food, beverage, healthcare, industrial, e-commerce, and beyond.
Quantify packaging volume and value consumed per sector using production data and packaging intensity benchmarks.
Establish packaging usage per unit of end-use output - validated through primary interviews and industry publications.
Measure format and material penetration, and substitution dynamics across packaging formats and geographies.
Distribute consumption across geographies by industrial activity, per-capita trends, and regional packaging intensity.
Convert volumes into format-wise revenue using average selling prices by format and region.
Inputs: end-use production data, intensity benchmarks, primary-validated penetration rates.
ASPs validated by format, material, channel, and regional pricing surveys.
Illustrative distribution of packaging demand across key end-use industries globally

We assess market demand by analyzing the economics behind production - evaluating cost structures, scalability, and profitability to determine whether a product or service can be sustainably delivered at viable price points. This approach helps businesses confirm real-world feasibility before committing resources, ensuring that demand isn't just theoretical but backed by sound production and pricing fundamentals.
Catalogue all producers active across each packaging format - rigid, flexible, labels, closures, and smart packaging.
Quantify nameplate capacity by plant and region using company disclosures, plant-level records, and operations interviews.
Establish realistic utilization by segment and geography - adjusted for demand conditions and operating-rate benchmarks.
Derive actual output from capacity and utilization - the primary supply-side market size estimate.
Map production concentration across geographies - identifying supply concentration and capacity expansion trends.
Validate demand-side revenue against supply-side output - any material divergence triggers re-examination.
Applied at plant, regional, and global level for all active converters and manufacturers.
Traces material flow from primary input to finished packaging output - validating downstream estimates independently.

Translate raw material input into finished packaging output using conversion ratios validated per material type.
Account for process losses between input and saleable output - trim waste, defects, and quality rejects.
Not all installed instruments operate at full reagent utilization. Compliance rates account for instruments in intermittent use, seasonal testing fluctuations, and competitive reagent switching. These adjustments prevent the model from overstating realized consumables demand.
Compare implied material consumption against independently sourced supply data. Where figures diverge beyond an acceptable threshold, estimates are re-examined before progressing.
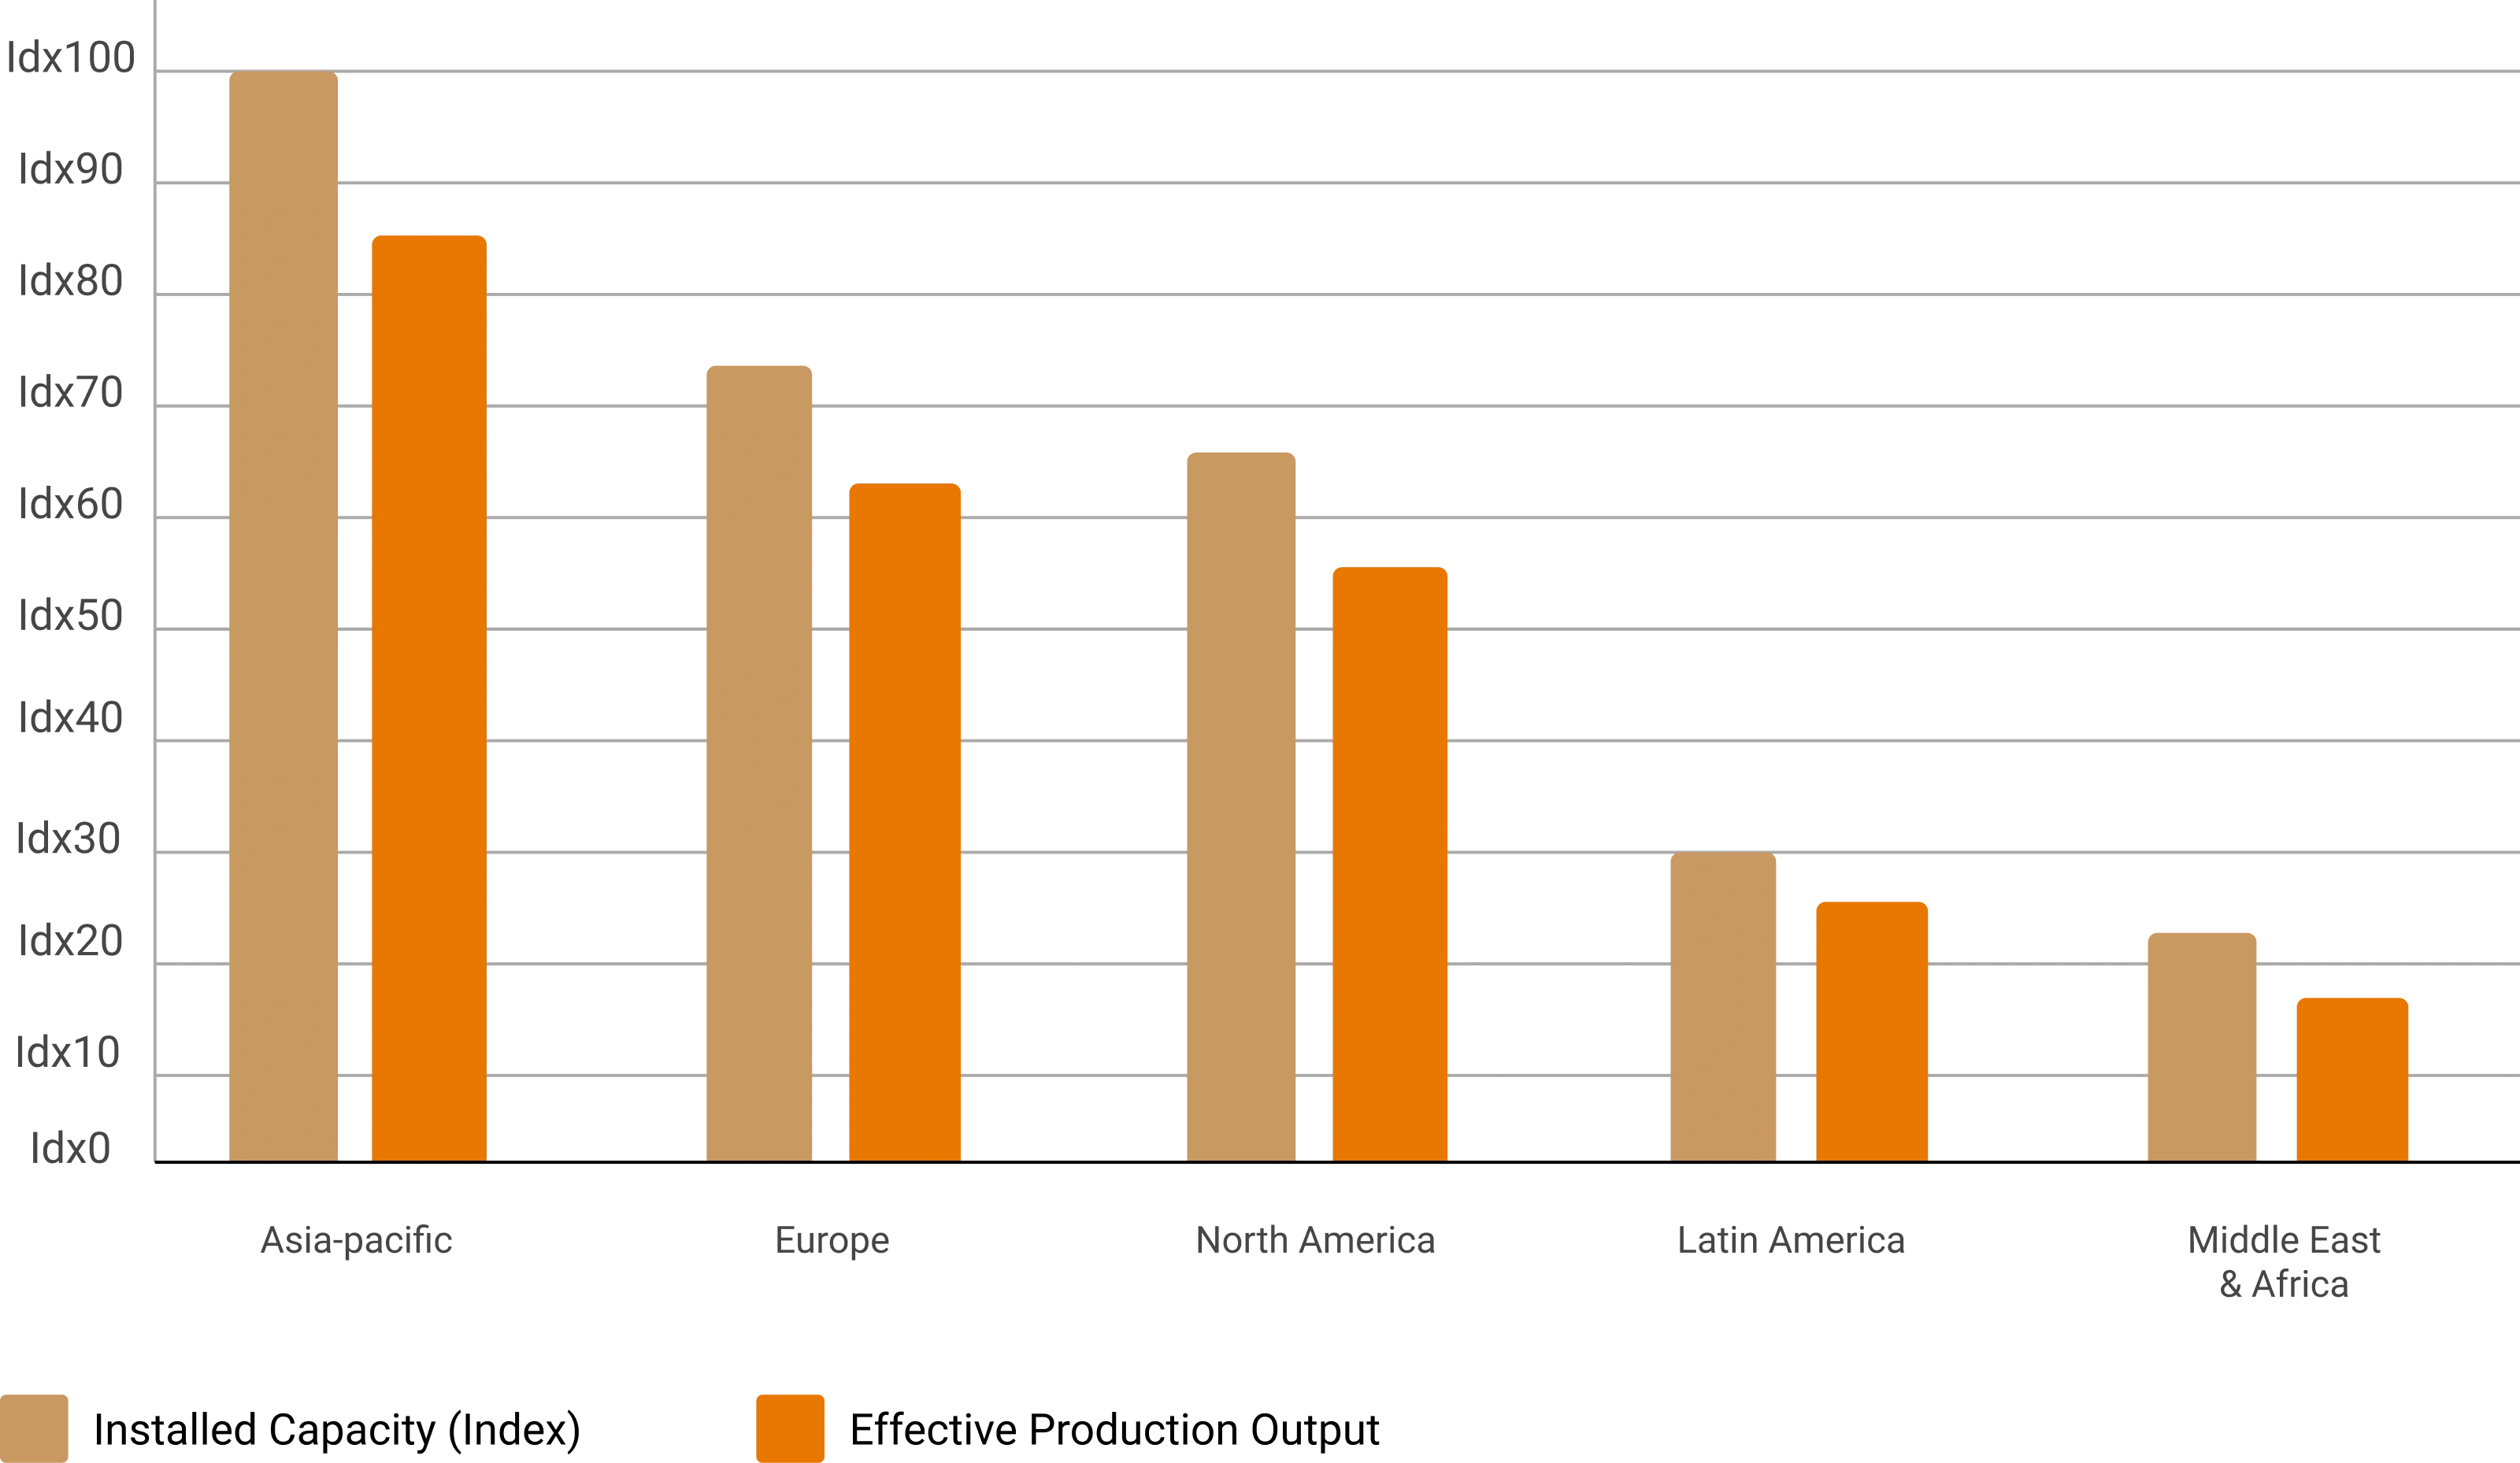
Illustrative comparison after capacity utilization rate adjustment across major packaging manufacturing regions
We assess market demand by analyzing the economics behind production - evaluating cost structures, scalability, and profitability to determine whether a product or service can be sustainably delivered at viable price points. This approach helps businesses confirm real-world feasibility before committing resources, ensuring that demand isn't just theoretical but backed by sound production and pricing fundamentals.
Captured at product and material level by origin market - identifying supply dependency and pricing benchmarks across regions.
Captured at product and material level by destination market - revealing production surplus and export competitiveness.
Cross-referenced against supply-side output estimates - any divergence triggers re-examination of underlying assumptions.
Customs classifications aligned to packaging formats - enabling accurate product-level trade disaggregation.
Identifies net-importing and net-exporting geographies - flagging structural supply imbalances and regional price differentials.
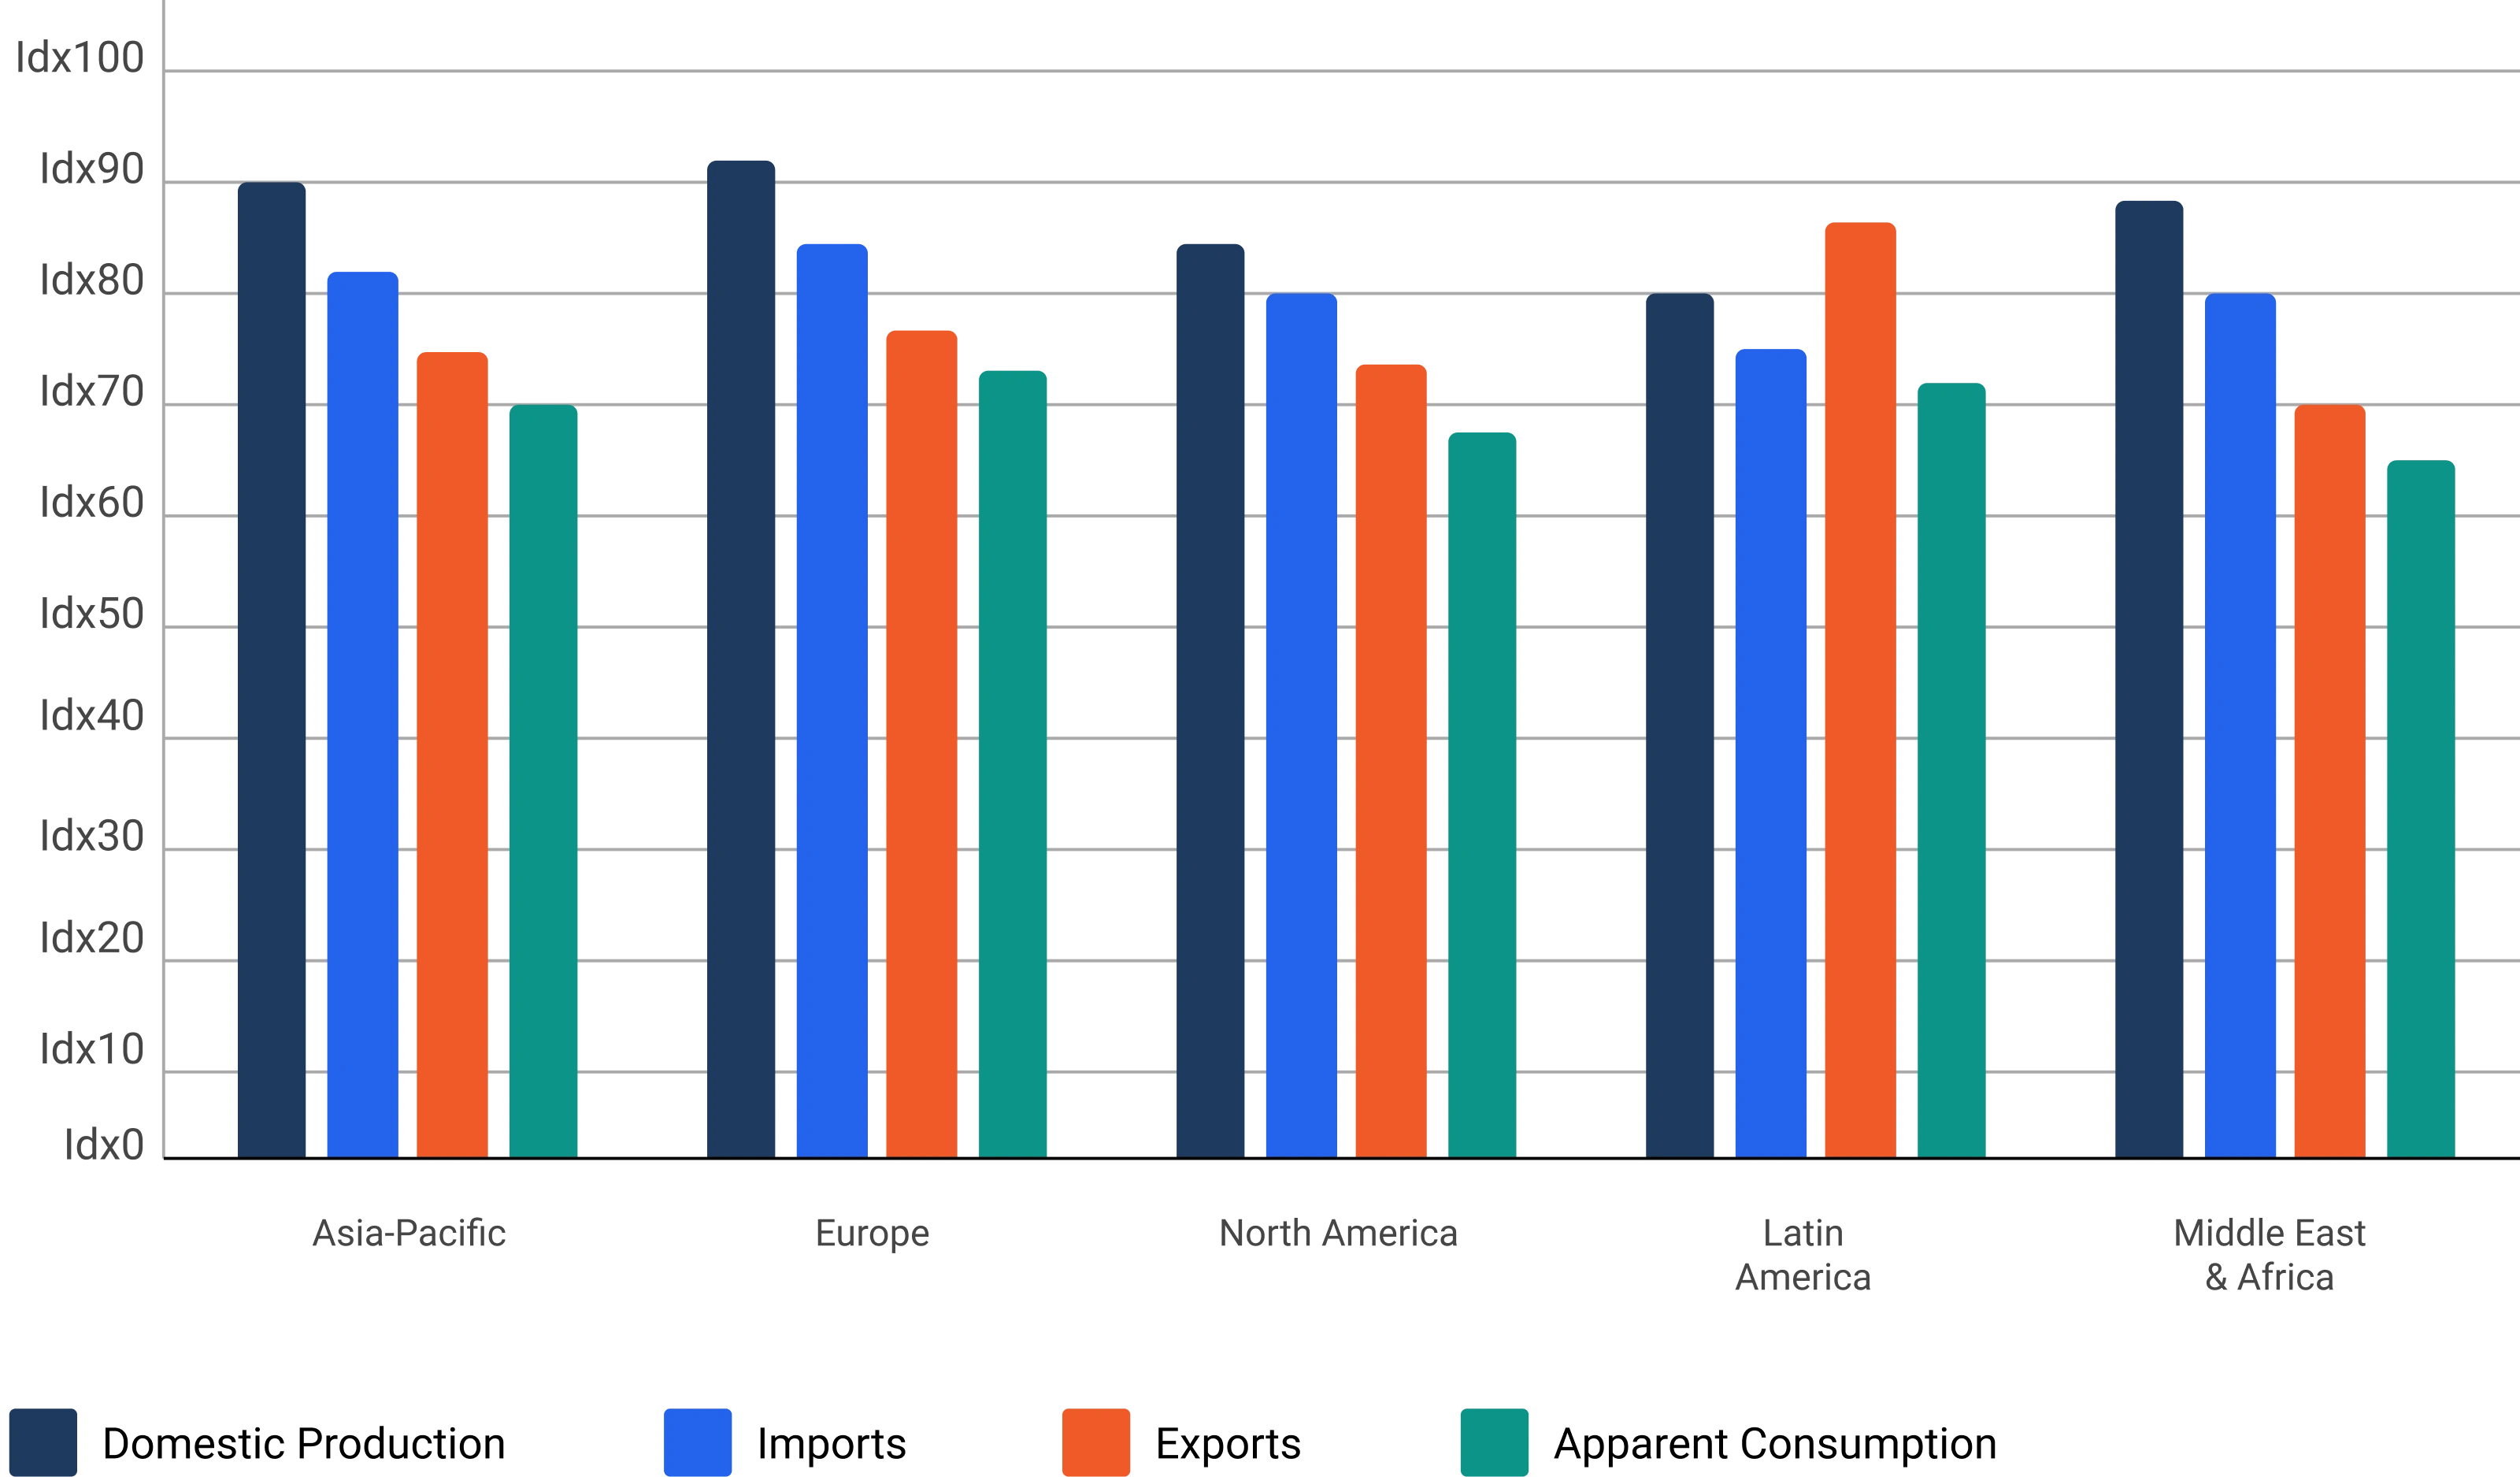
Apparent Consumption = Domestic Production + Imports − Exports
Relative applicability score of each bottom-up model across five assessment criteria
We strengthen the accuracy of our market findings by cross-verifying data from five independent estimation approaches - including top-down and bottom-up analysis, supply-side tracking, demand-side surveys, and macroeconomic modeling. By reconciling these diverse data streams, we eliminate inconsistencies, minimize bias, and arrive at a validated, high-confidence market estimate that decision-makers can rely on with certainty.
Each methodology is weighted by data reliability and market maturity - not treated equally by default.
Every estimate carries a confidence score reflecting source quality, consistency, and primary corroboration.
Variances beyond an acceptable threshold trigger additional primary validation before an estimate is finalized.
Relative weight each input methodology contributes to the final reconciled market estimate

We analyze historical market data, past growth patterns, and key inflection points to build a clear picture of where the market has been. This foundation allows us to project future trajectories with greater precision - translating past performance into forward-looking insights that help businesses anticipate shifts, capitalize on emerging opportunities, and plan strategically for what lies ahead.
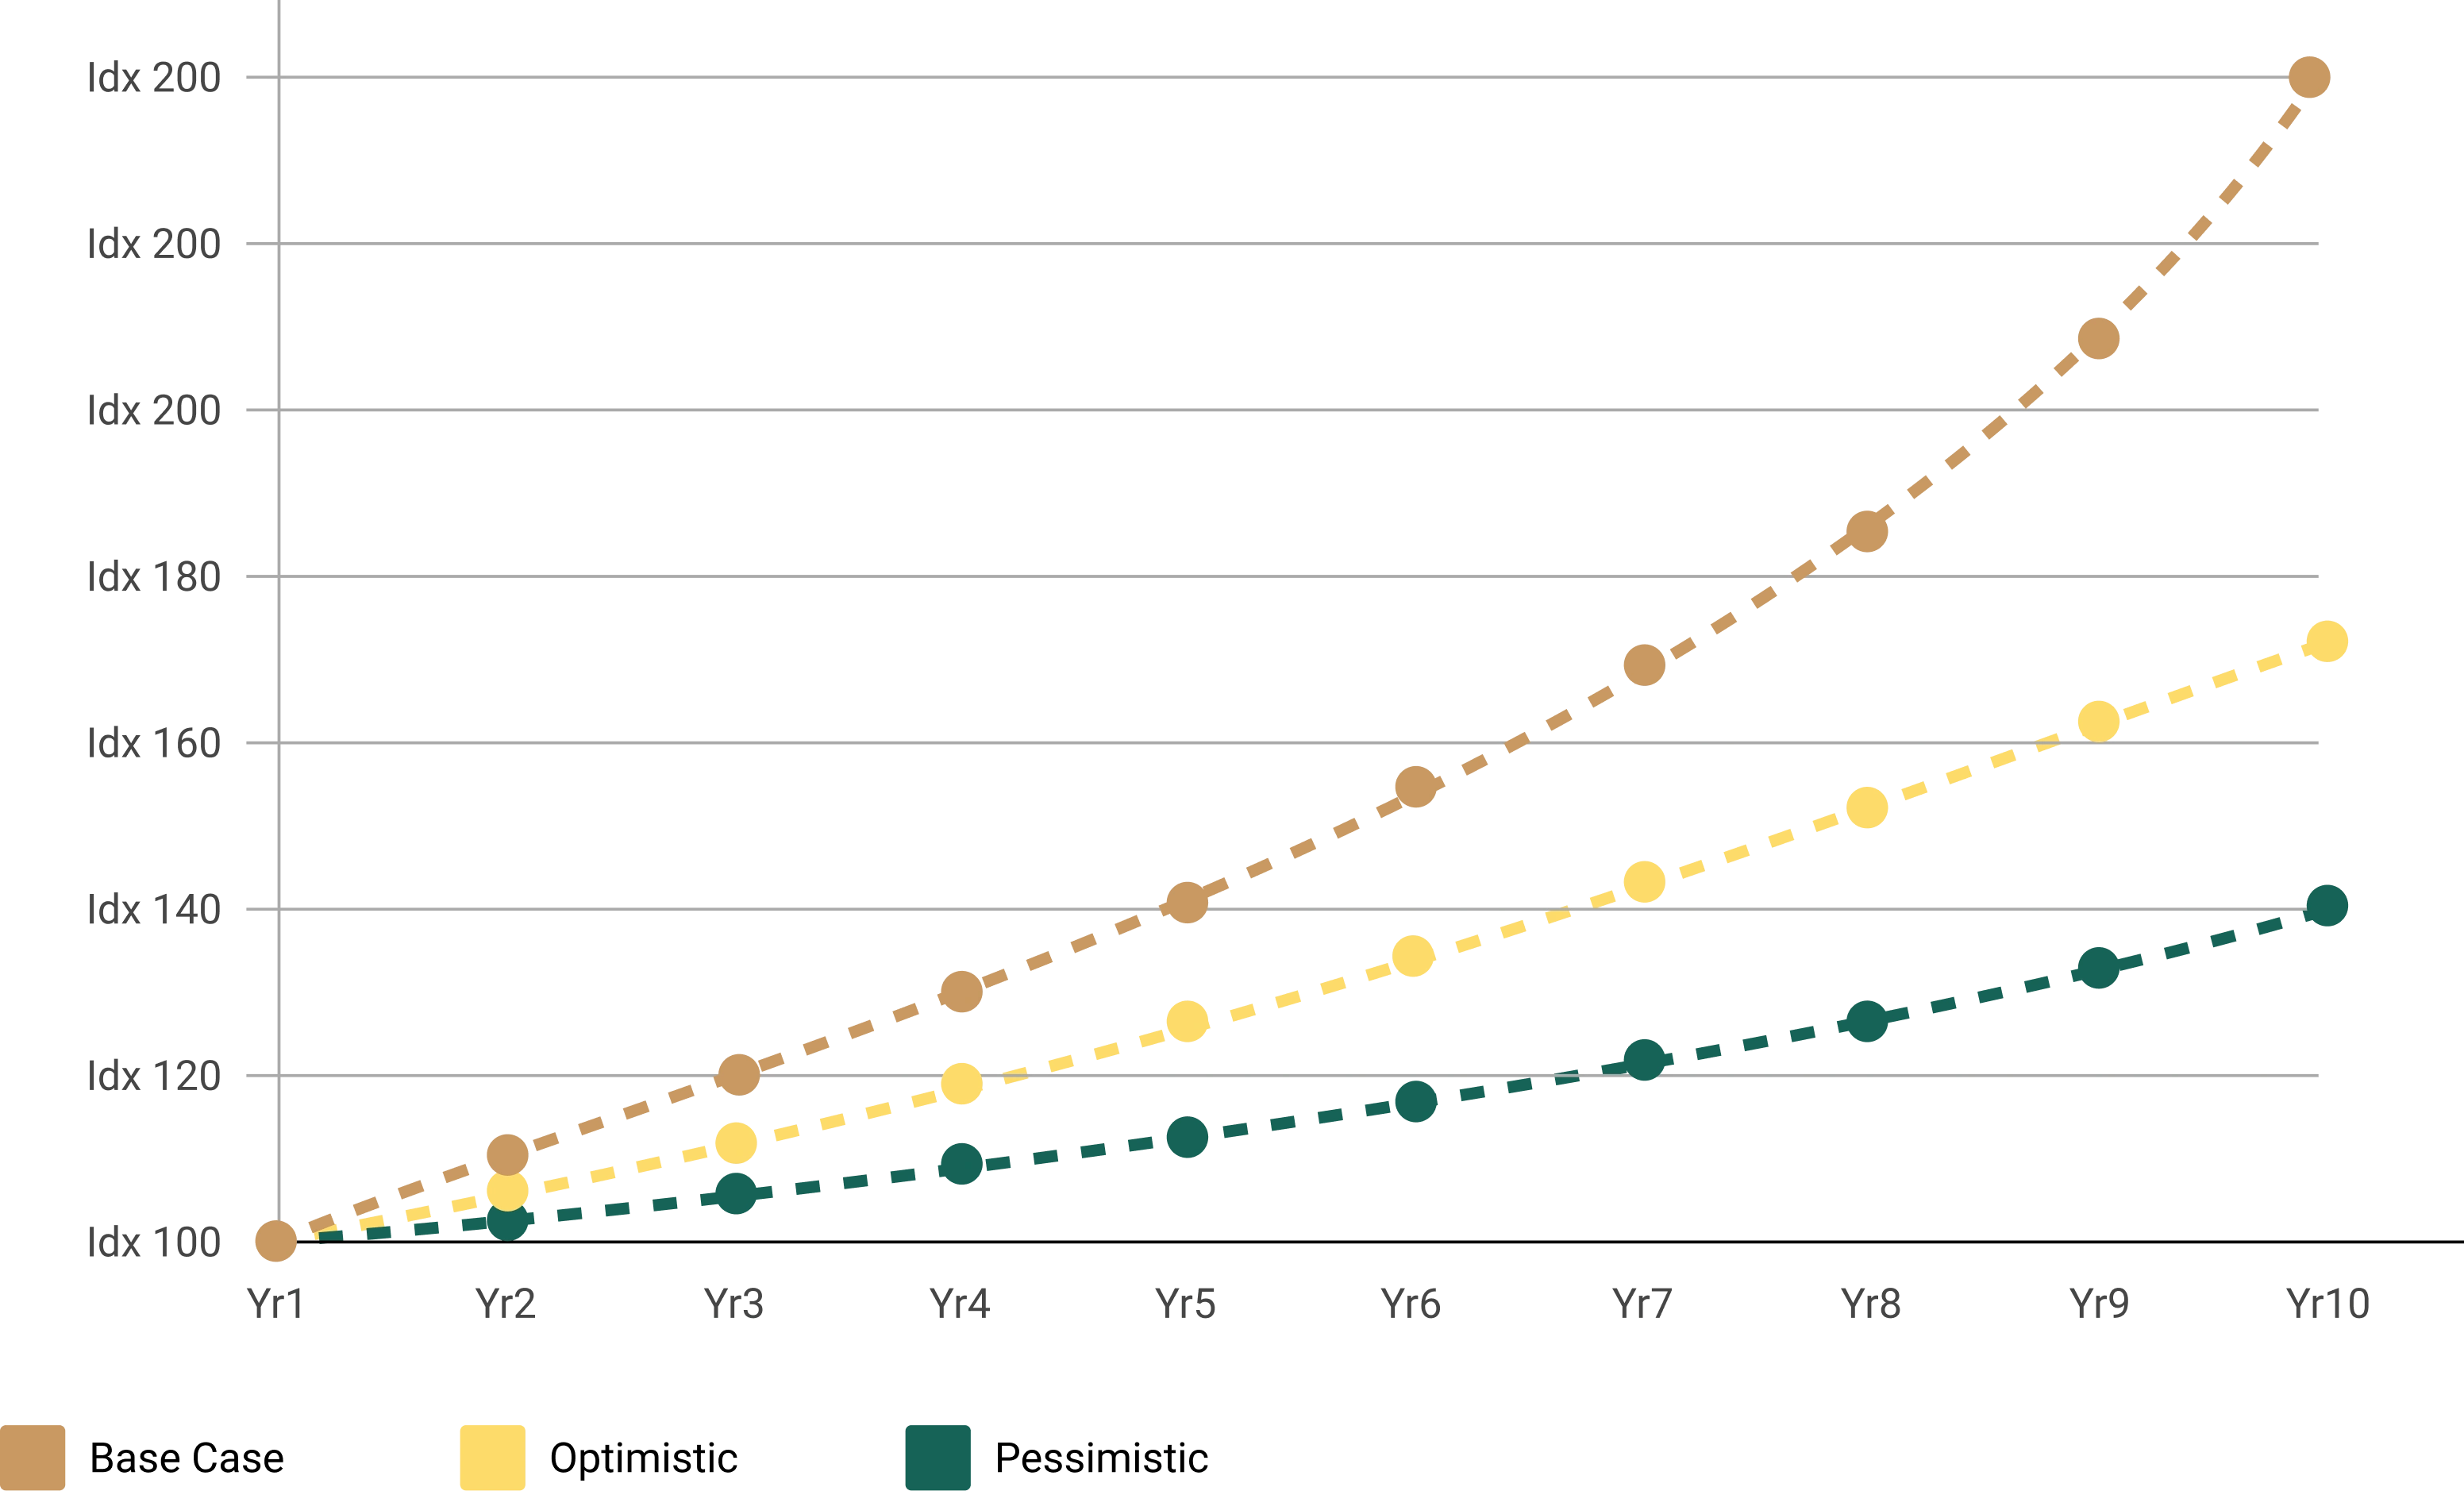
Illustrative Base, Optimistic, and Pessimistic growth trajectories across a 10-year forecast horizon
Relative impact score (0–100) of each input dimension on packaging market forecasts
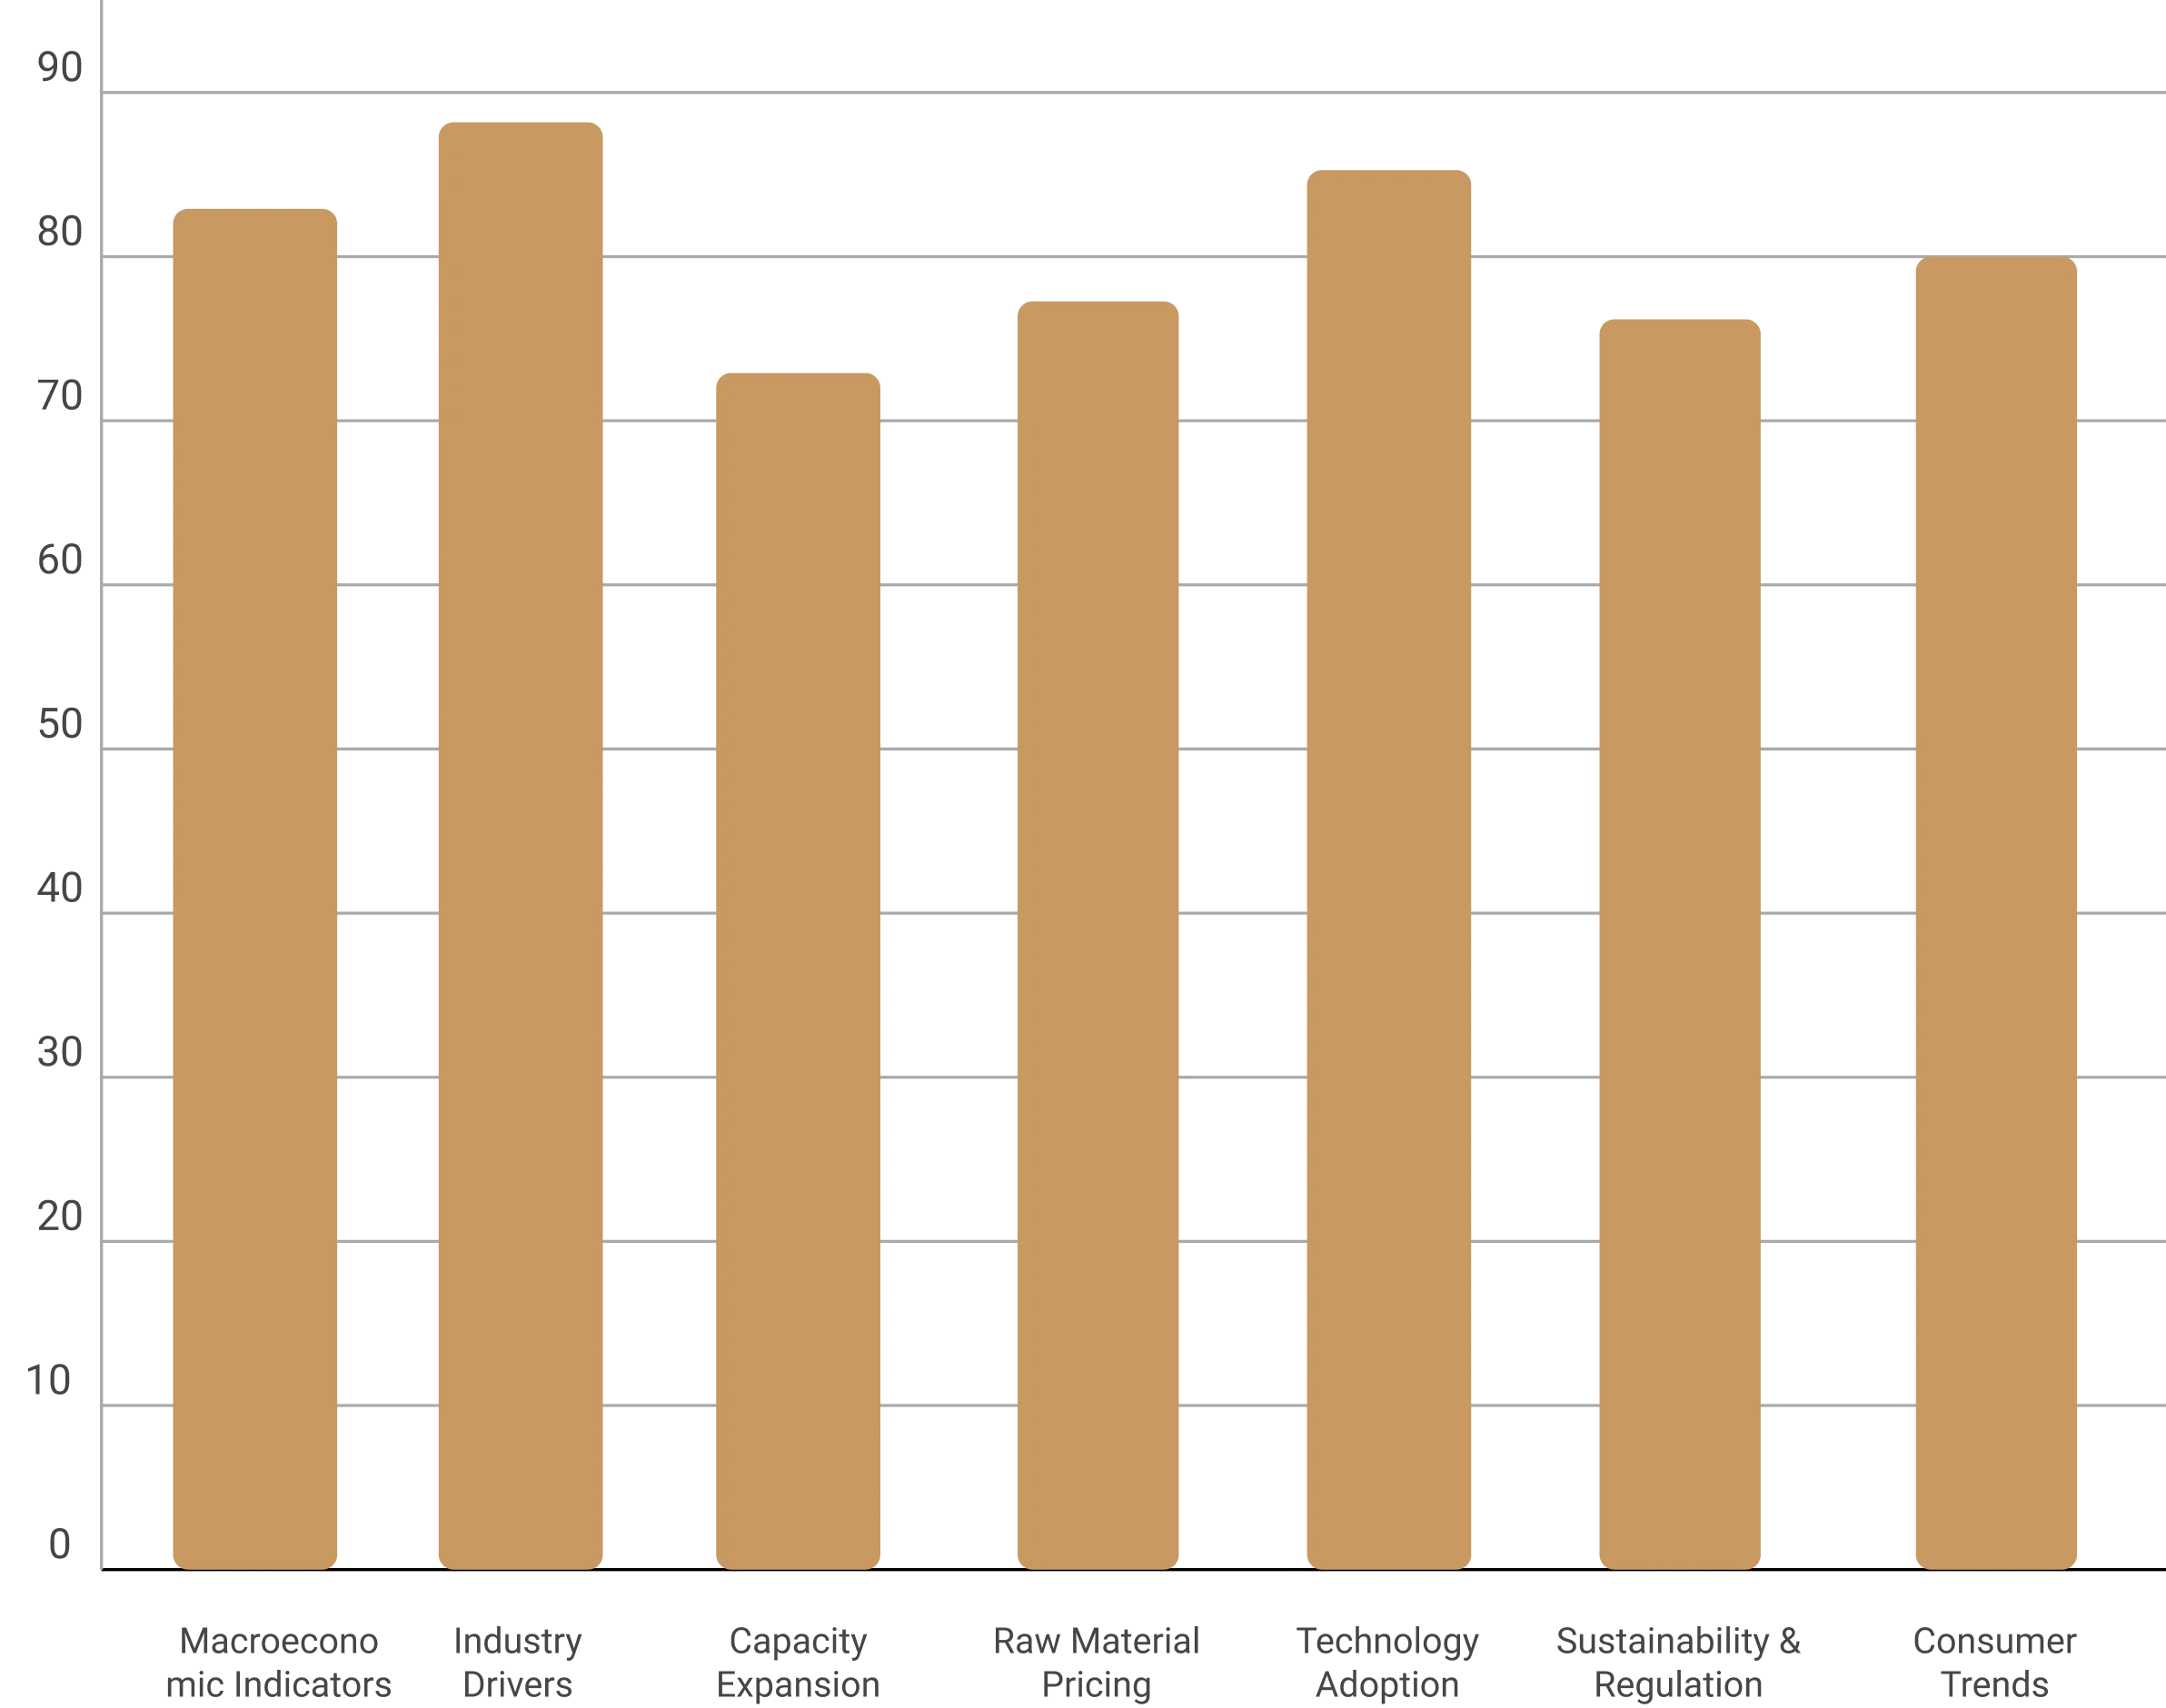
We analyze historical market data, past growth patterns, and key inflection points to build a clear picture of where the market has been. This foundation allows us to project future trajectories with greater precision - translating past performance into forward-looking insights that help businesses anticipate shifts, capitalize on emerging opportunities, and plan strategically for what lies ahead.
Secondary research builds the factual foundation - published, verifiable information that anchors every assumption before primary validation begins.
| Source Category | Details |
| Government & Trade Bodies | Production, trade, and regulatory statistics |
| Industry Associations | Segment definitions, standards, and benchmarks |
| Company & Investor Disclosures | Annual reports, investor presentations, capacity data |
| Trade & Patent Databases | Technology trends and competitive activity |
| Academic & Technical Literature | Material science and process innovation |
| Conference Proceedings | Emerging technology and sustainability themes |
| Packaging Standards & Regulations | Compliance, labeling, and safety requirements |
| Internal Proprietary Database | Historical benchmarks and prior study data |
Our proprietary database, built from years of primary research and continuous market tracking, forms the backbone of every report we deliver. Combined with a rigorous quality assurance process - including multi-stage data validation, expert review, and cross-verification with primary intelligence - we ensure that every insight is accurate, reliable, and ready to support confident business decisions.
A curated archive of past market data and trends used to benchmark current findings.
Comparative data on packaging formats, materials, and standards across industries.
Comprehensive records of pricing trends and production capacities across markets.
Detailed tracking of import-export patterns and global trade movements.
A collection of expert and stakeholder interviews providing primary market intelligence.
Historical research reports and studies used to validate and cross-check new findings.
Every figure is checked against adjacent data points and prior studies for logical consistency - eliminating anomalies before publication.
Outlier detection and variance analysis applied across all data sets - flagging estimates that deviate beyond acceptable statistical bounds.
Findings cross-checked against independent secondary and primary sources - no single-source dependency in the final estimate.
Senior analyst review and sign-off precede every published estimate - ensuring strategic coherence and cross-study consistency.

Principal Research Analyst
Vidyesh Swar is a Senior Research Analyst at Towards Packaging, bringing over 4 years of dedicated expertise in market intelligence and strategic analysis across the dynamic world of packaging technologies and solutions.
Learn more about Vidyesh Swar
Reviewed By
Aditi Shivarkar, with 14+ years in packaging market research, specializes in food, beverage, and eco-friendly packaging. She ensures accurate, actionable insights, driving Towards Packaging Analytics & Consulting 's excellence in industry trends and sustainability.
Learn more about Aditi Shivarkar

 Table of Content

 +1 804-441-9344
 Download Sample
 Schedule a Meeting