


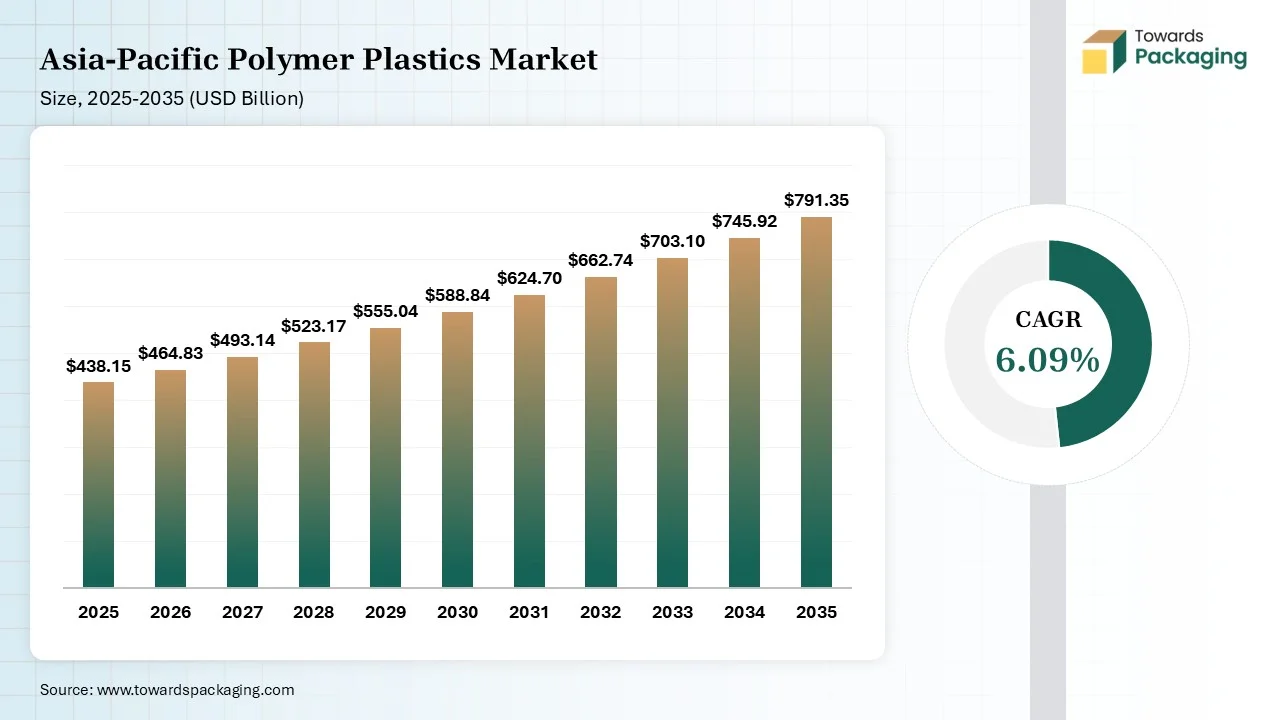
According to Vidyesh Swar, who is a specialist in conventional packaging, polymer packaging, smart packaging, and packaging materials. The Asia-Pacific Polymer Plastics Market size was estimated at USD 438.15B in 2025 and is expected to grow at a 6.09% CAGR during the forecast period. The market is predicted to reach a value of $791.35B by 2035. The increasing investment in construction, demand for lightweight vehicles, and modernization of healthcare drive the growth. The regional leaders like LG Chem, Formosa Plastics Group, Asahi Kasei Corporation, and Sumitomo Chemical contribute to the growth.
Polymer plastics are man-made synthetic materials made up of monomers. Their characteristics are low density, high moldability, excellent viscoelasticity, and high durability. They offer benefits like design flexibility, cost-effectiveness, strong product protection, and high thermal insulation. The types of polymer plastics are elastomers, thermoplastics, and thermosetting plastics. They are widely used across modern industrial applications.
Polymer plastics like thermosets, bioplastics, thermoplastics, and others easily converted into films, compounds, and other formats. Polymer plastics are used across industries like packaging, automotive, healthcare, construction, and others in the APAC region. China held more than a 50% share in the market in 2025. Bioplastics and biodegradable polymers are expected to grow at the fastest CAGR through 2035.
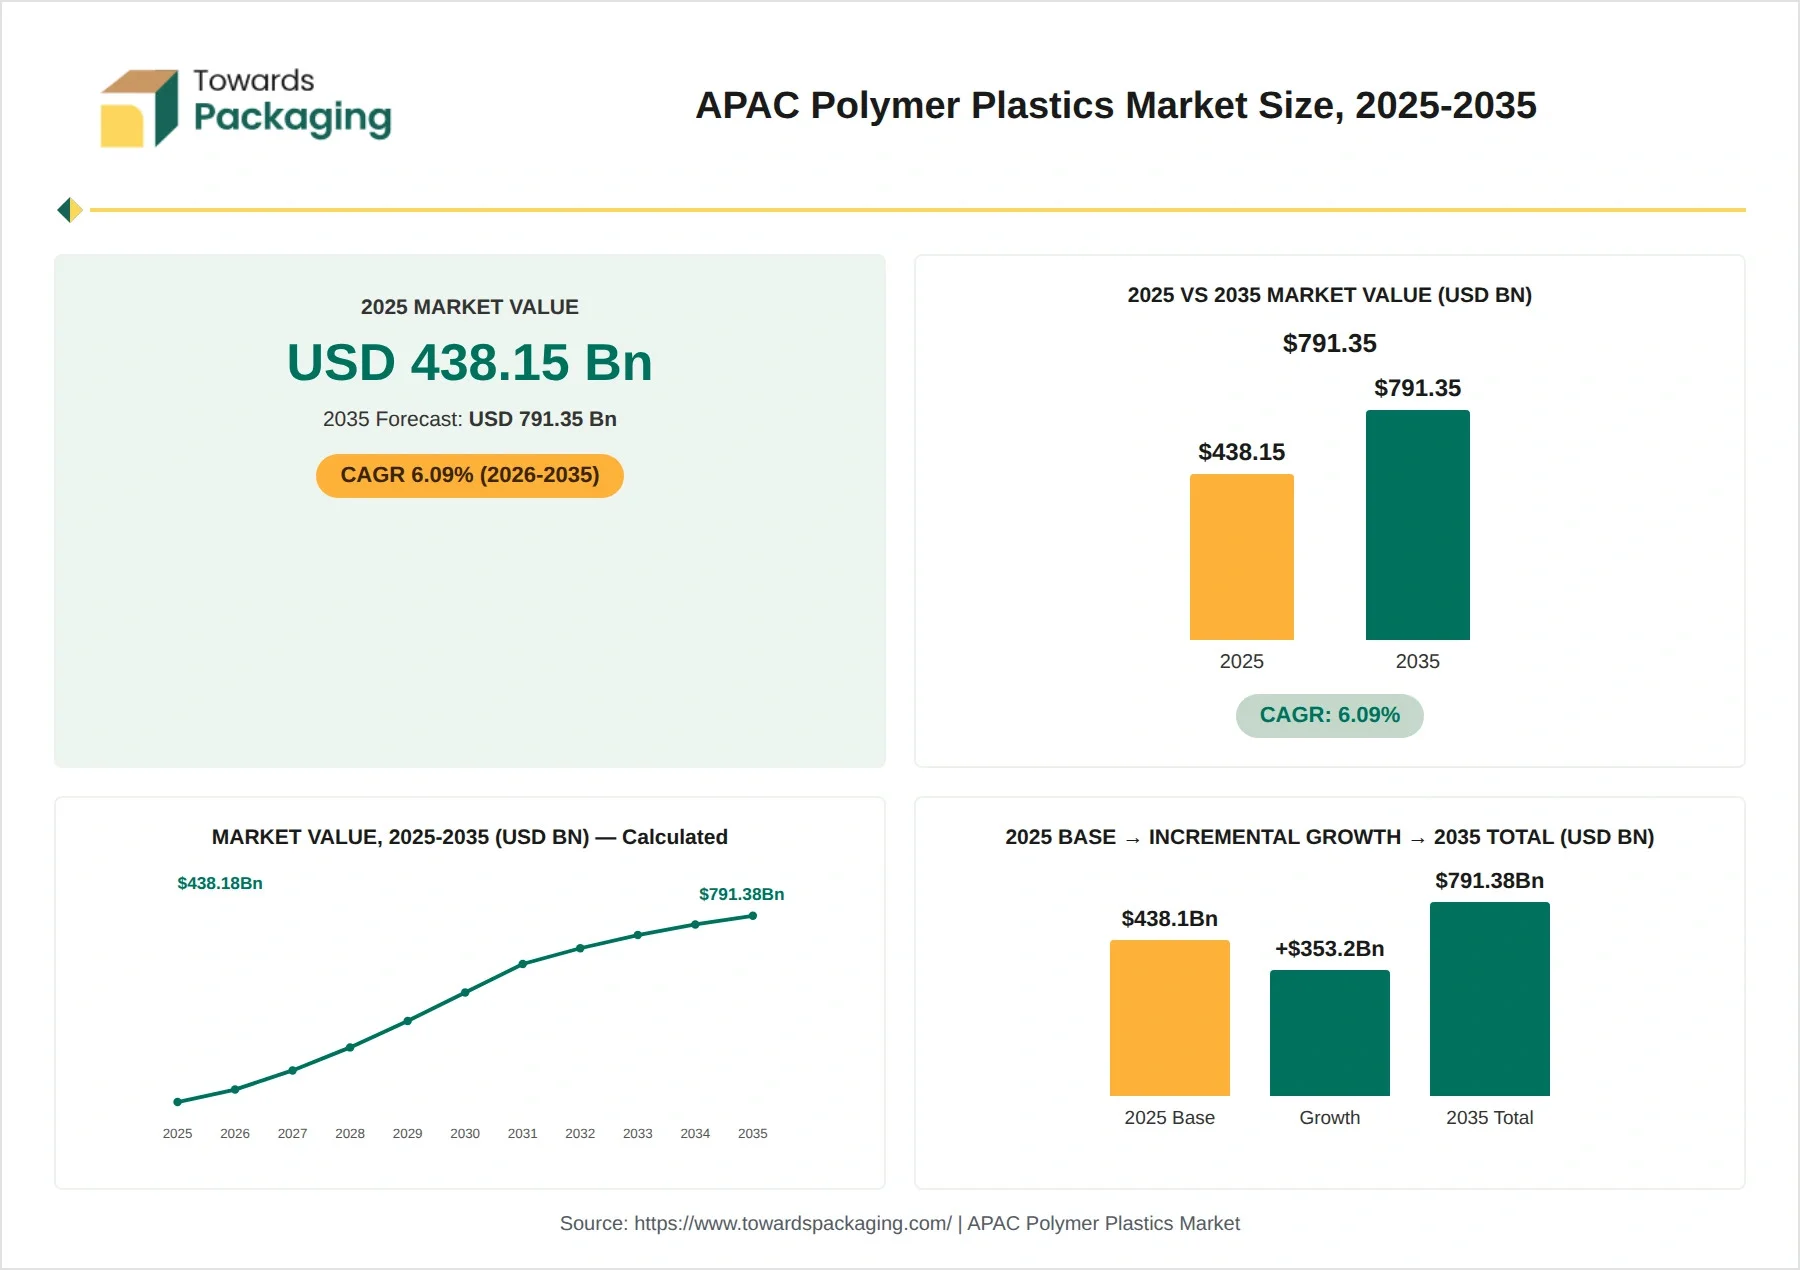
Source: Towards Packaging Analytics & Consulting; calculated compounding
The Asia-Pacific Polymer Plastics Market value was $438.15B in 2025. The market is expected to grow at a CAGR of 6.09% during 2026 to 2035. Factors like automotive lightweighting, scaling e-commerce demand, strong 5G base stations, pharma infrastructure modernization, innovations in plastic compounding, expanding bio-derived polymers, growing building activities, and huge EV manufacturing drive the growth. Companies like Formosa Plastics Corporation, LG Chem, Toray Industries, Mitsubishi Chemical Group, and SABIC are major players in 2025.
The market is expected to reach $791.35B by 2035. The incremental value of the market is $353.20B over the decade. Factors like surging construction projects, use of lightweight vehicles, investment in bio-based polymers, expansion of advanced mechanical recycling, rise in electrical appliances, and burgeoning automated extrusion will support the growth. Companies like LG Chem, SABIC, Sumitomo Chemical, Mitsubishi Chemical, and Formosa Plastics focus on developing advanced materials and sustainable polymers.
Key Insights:- The market is expected to reach $791.35B by 2035.
Source: Towards Packaging Analytics & Consulting
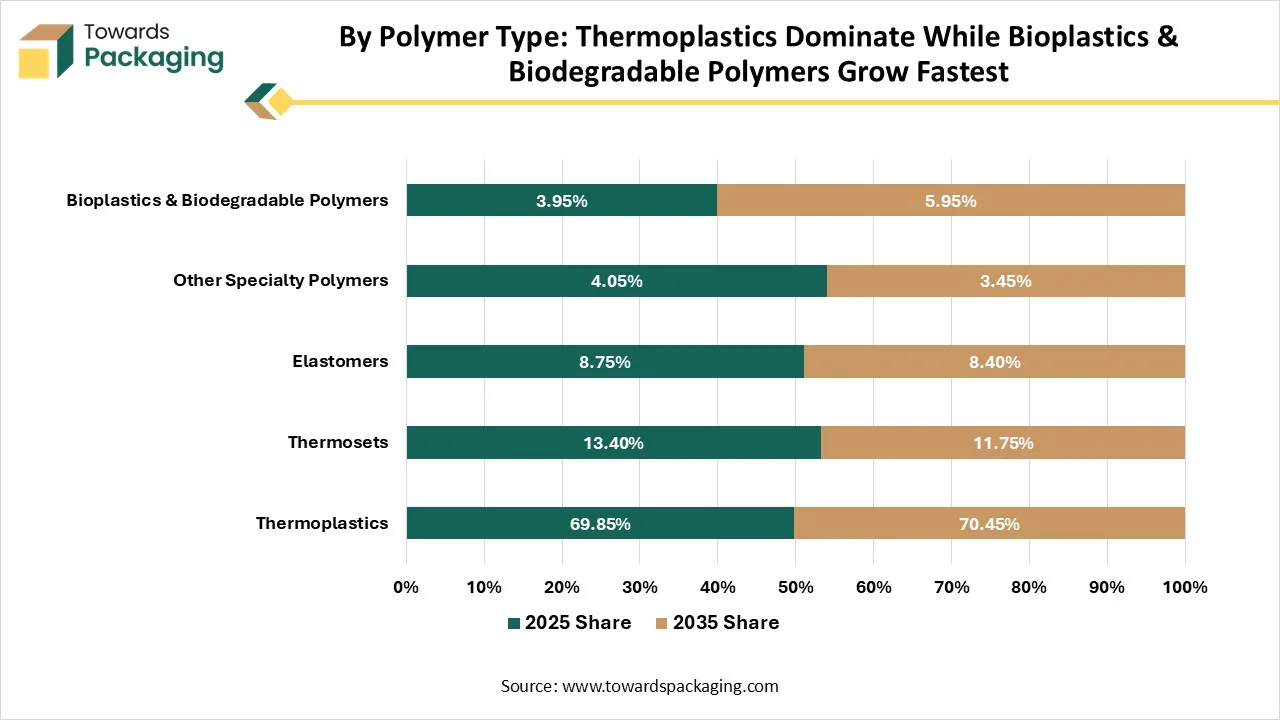
Thermoplastics dominated the APAC polymer plastics industry with a 69.85% share in 2025. The higher need for packaging in APAC and focus on enhancing fuel efficiency increase the use of thermoplastics. The optimal mechanical strength, high processability, and manufacturing efficiency of thermoplastic drives the overall growth. Bioplastics & biodegradable polymers are expected to grow at the fastest CAGR of 10.25% during the forecast period. The abundance of biomass resources and the popularity of sustainable packaging increase the use of bioplastics & biodegradable polymers. The established local production plants and green retail packaging support the growth.
Key Insights:- Bioplastics & biodegradable polymers exhibit the fastest growth.
Source: Towards Packaging Analytics & Consulting
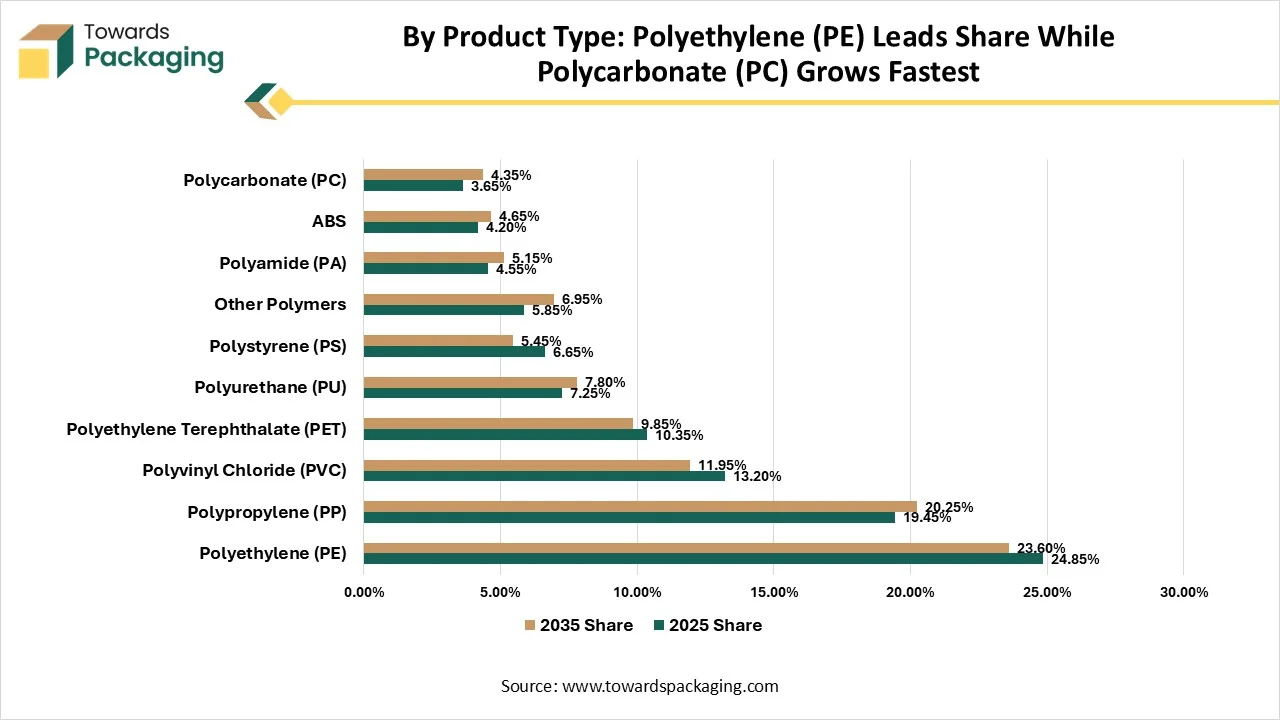
Polyethylene (PE) dominated the APAC polymer plastics industry with a 24.85% share in 2025. The extensive demand for flexible packaging films and the development of industrial containers increase the use of PE. The growth in plastic conversion infrastructure and the rise in recycled PE technologies drive the growth. Polycarbonate (PC) is expected to grow at the fastest CAGR of 8.05% during the forecast period. The production of electronic display lenses and the focus on enhancing EV battery range increase the adoption of PC. The creation of building panels and the stringent OEM sustainability goals boost the overall growth.
Key Insights:- Polycarbonate exhibits the fastest growth.
Source: Towards Packaging Analytics & Consulting
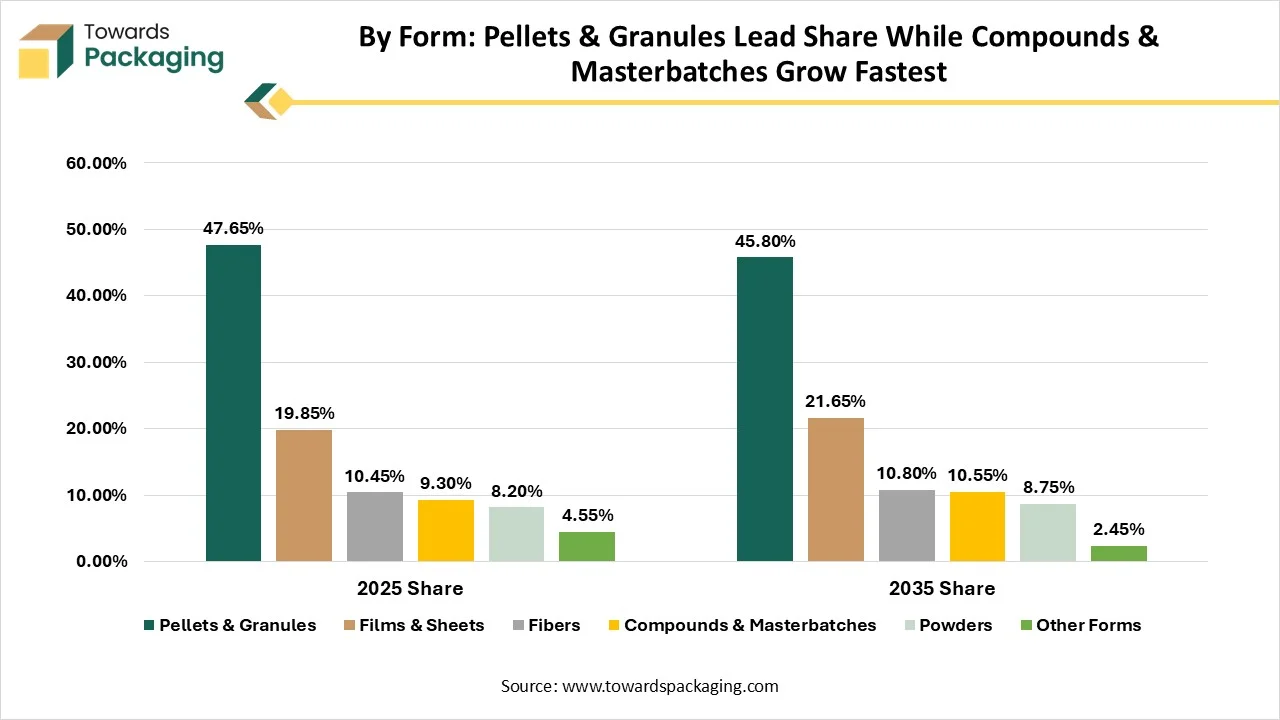
Pellets & granules dominated the APAC polymer plastics industry with a 47.65% share in 2025. The rise in injection molding and focus on lower thermal degradation increase the use of pellets & granules. The standardized flow, precise melting rates, and easy compounding in pellets & granules drive the growth. Compounds & masterbatches are expected to grow at the fastest CAGR of 7.75% during the forecast period. The need to extend fuel efficiency in automotive and the rise in rigid consumer packaging increases use of compounds and masterbatches. The rise in utility projects and a massive petrochemical base supports the growth.
Source: Towards Packaging Analytics & Consulting
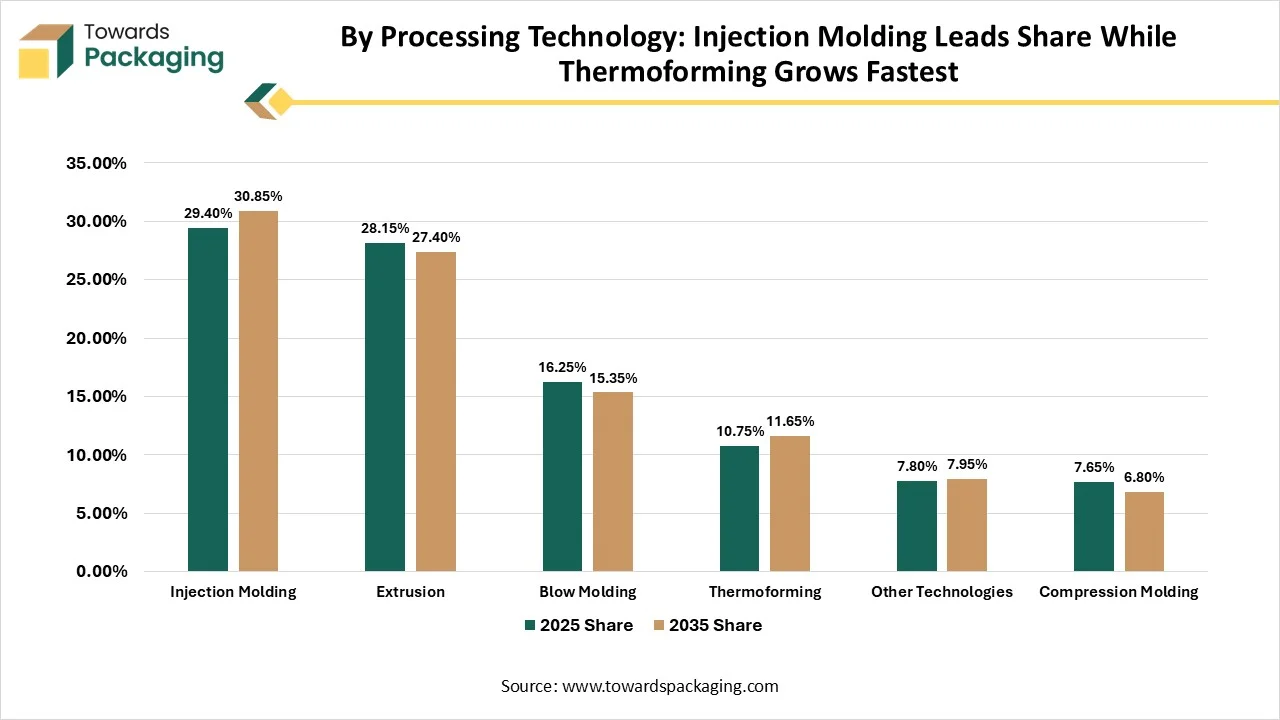
Injection molding dominated the APAC polymer plastics industry with a 29.40% share in 2025. The automotive parts production infrastructure and the burgeoning consumer markets increase the use of injection molding. The chip operating price and the development of thin-wall containers drive the growth. Thermoforming is expected to grow at the fastest CAGR of 6.85% during the forecast period. The interest in lightweight trays and the increasing healthcare needs increase the use of thermoforming. The robust semiconductor development and spending on durable goods increase the use of thermoforming, boosting growth.
Key Insights:- Thermoforming exhibits the fastest growth.
Source: Towards Packaging Analytics & Consulting
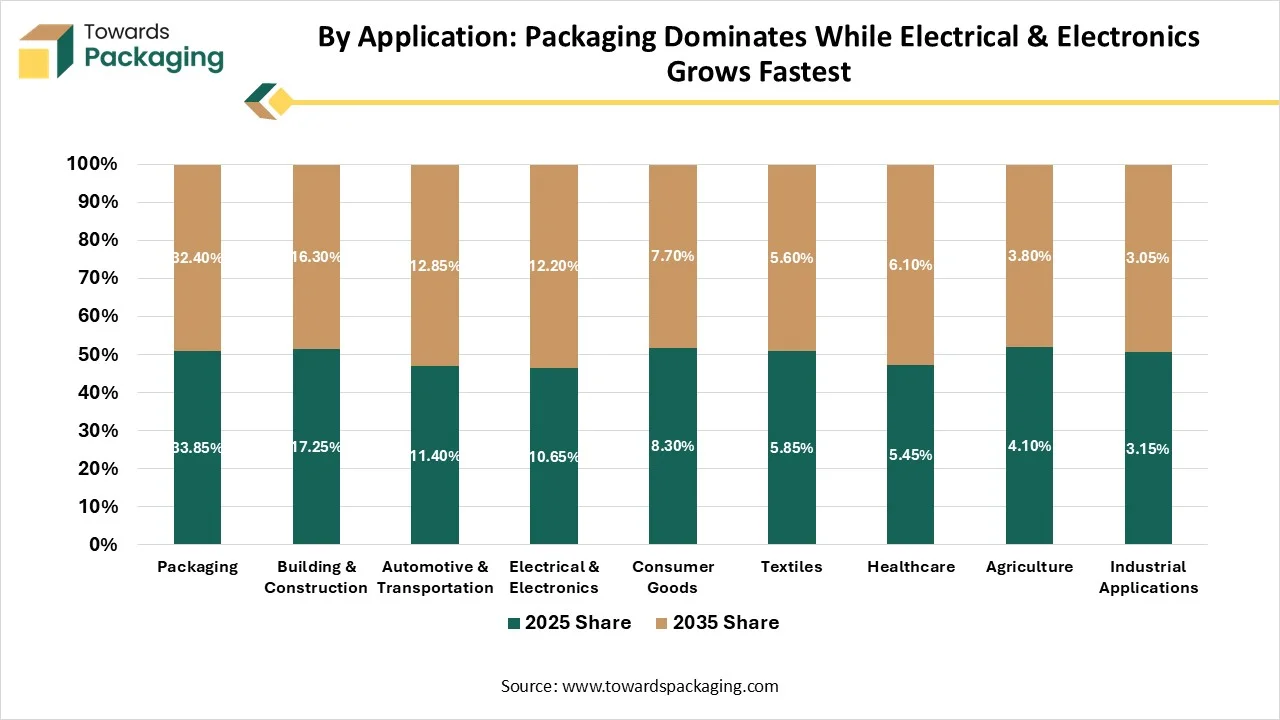
Packaging dominated the APAC polymer plastics industry with a 33.85% share in 2025. The high scaling of modern retail and the need for pharmaceutical films increase the use of polymer plastics. The rise in cheaper packaging resins and high demand for plastic packaging increases the use of polymer plastics. Electrical & electronics is expected to grow at the fastest CAGR of 7.85% during the forecast period. The massive production of home appliances and rollout of AI hardware increases the use of polymer plastics. The use of insulators in EVs and modernization of household appliances boost the overall growth.
Key Insights:- Electrical & electronics is growing at the fastest CAGR.
Source: Towards Packaging Analytics & Consulting
Packaging & food processing dominated the APAC polymer plastics industry with a 35.40% share in 2025. The rise in RTE food packaging and the online grocery boom increases the use of polymer plastics. The use of flexible pouches in supermarkets and scaling subscriptions of meal kits boost the growth. Electronics & electrical is expected to grow at the fastest CAGR of 8.25% during the forecast period. The rapid growth in IoT infrastructure and expanding EV integration increases the use of polymer plastics. The high manufacturing base for smartphones, home appliances, and other electronics in ASEAN countries supports the overall growth.
Key Insights:- Electronics & electrical exhibits the fastest growth.
Source: Towards Packaging Analytics & Consulting
China
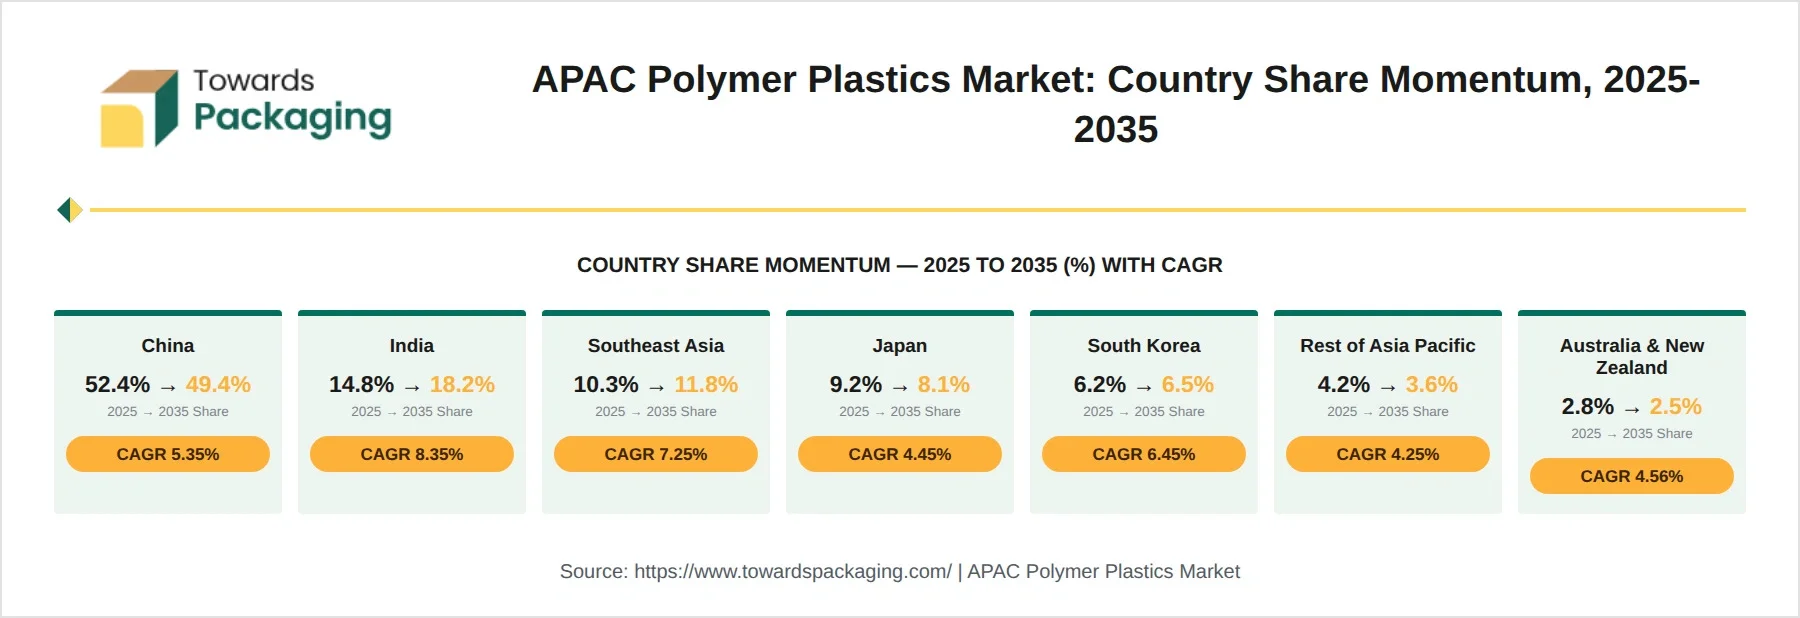
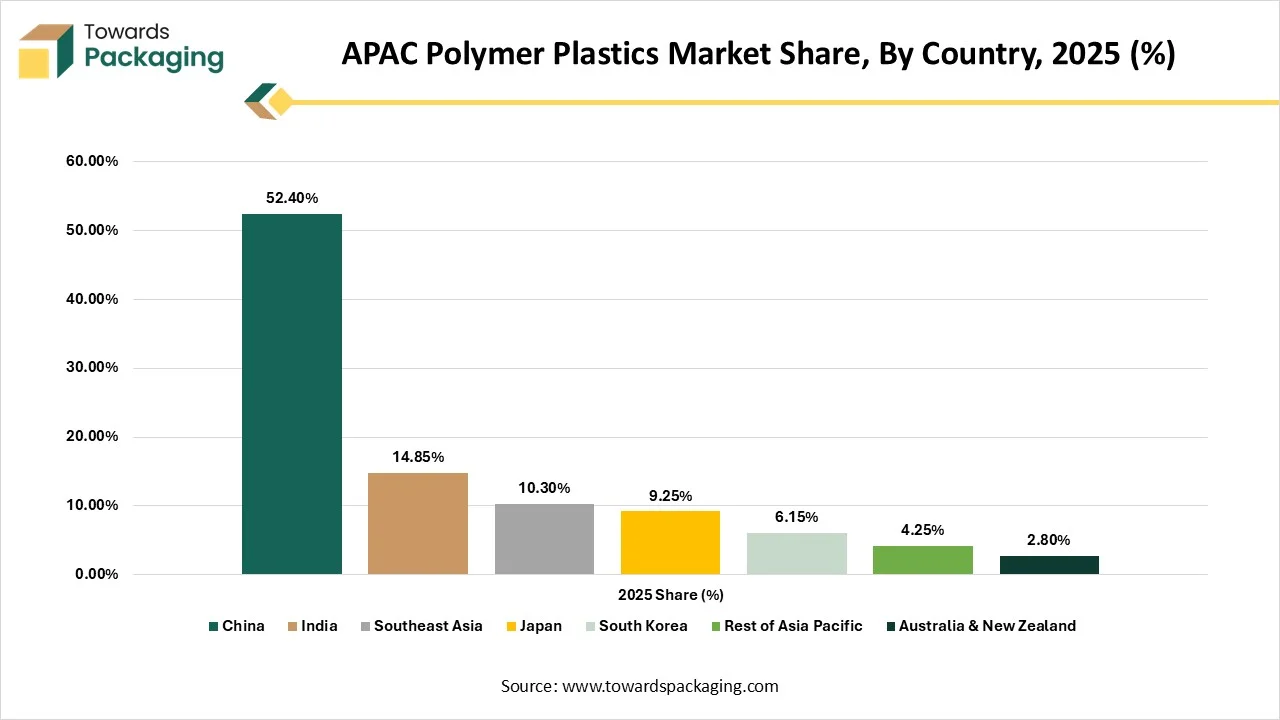
China dominated the Asia-Pacific Polymer Plastics Market with a 52.4% share in 2025. The high motor vehicle production base and large industrial scale increase demand for polymer plastics. The strong consumer technology infrastructure and advanced manufacturing practices increase the use of polymer plastics. The extensive internal demand for building materials and the manufacturing of heavy trucks drive the overall growth.
India
India held a 14.8% share in the market in 2025. The high logistics demand for packaging and the demand for high-performance plastics in end-user industries increase adoption of polymer plastics. The Make in India policy and the rise in the PLA industry help with expansion. The demand for injection-molded components boosts the overall growth.
Southeast Asia
Southeast Asia held a 10.3% share in the market in 2025. The strong influx of automotive manufacturing and massive regional infrastructure development increases the use of polymer plastics. The increasing number of the urban middle class and regional mandates for PCR polymer support the overall growth of the market.
Japan
Japan held a 9.2% share in the market in 2025. The demand for engineered plastics in the electrical industry and digital transformation leadership increases the use of polymer plastics. The demand for minimally invasive healthcare instruments and the high demand for diverse medical procedures increase the use of polymer plastics, supporting growth.
South Korea
South Korea held a 6.2% share in the market in 2025. The rise in improvement in EV range and leading semiconductor base increases the use of polymer plastics. The huge adoption of recycled polymer formulations and domestic innovation programs helps with expansion. Local companies like Lotte Chemical drive the overall growth of the market.
Key Insights:- India exhibits the fastest growth.
Source: Towards Packaging Analytics & Consulting
China dominated the APAC polymer plastics industry with a 52.40% share in 2025 due to EV growth, increased production of off-highway equipment, and high manufacturing scale. India held a 14.85% share in the market in 2025 due to the massive growth in packaging and the acceleration in construction activities. Southeast Asia held a 10.30% market share in 2025 due to investment in electronics and heavy consumer goods consumption. Japan held a 9.25% market share in 2025 due to the dependence on specialized engineered plastics, a mature local packaging base, and stricter regulatory pushes. South Korea held a 6.15% market share in 2025 due to the massive petrochemical output, need for cleanroom-grade plastics, and vehicle electrification.
Key Insights:- China dominates, and India held the second-largest share in the market.
Source: Towards Packaging Analytics & Consulting
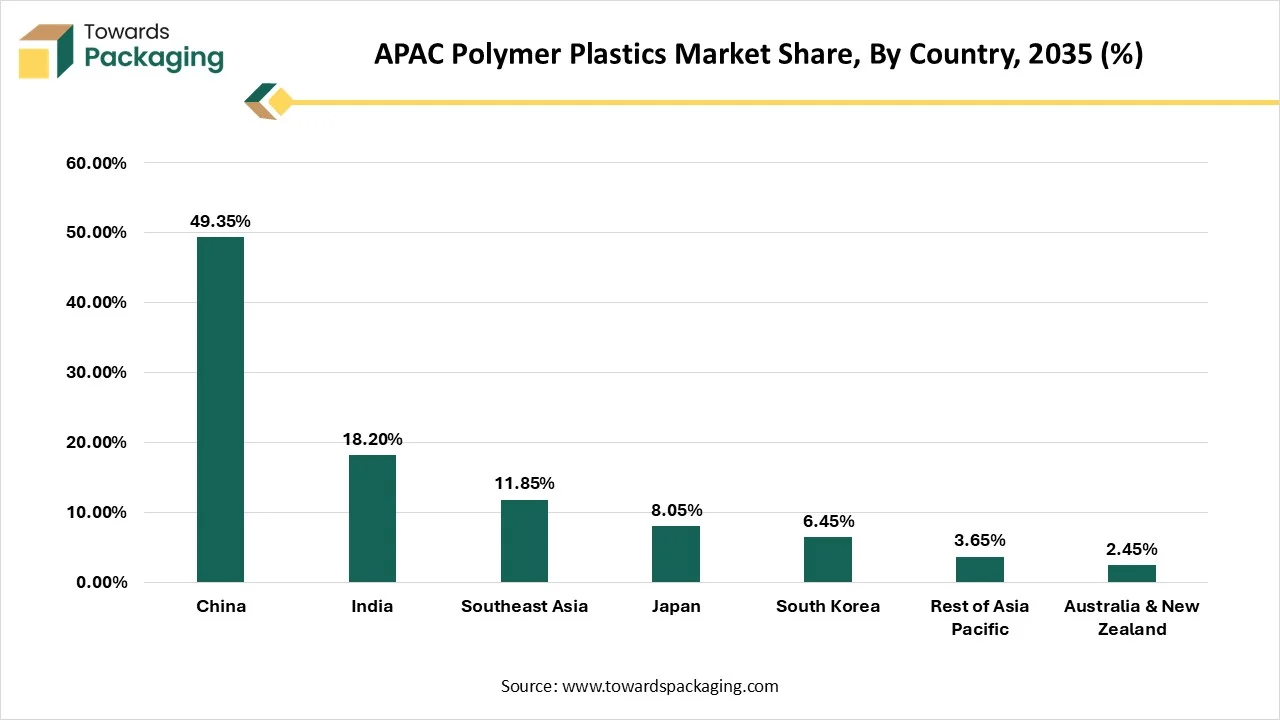
China is expected to hold a 49.35% share in the market by 2035 due to cheap petrochemical supply, use of plastic packaging, and development of building projects. India is expected to hold an 18.20% share in the market by 2035 due to rapid industrial production and exploding petrochemical capacities. Southeast Asia is expected to hold an 11.85% share in the market by 2035 due to the increasing investment in the automotive industry and the rise in structural development projects. Japan is expected to hold an 8.05% share in the market by 2035 due to the high-level automation, strong chemical recycling base, and packaging demand. South Korea is expected to hold a 6.45% share in the market by 2035 due to the advanced sorting infrastructure and the demand for engineering polymers in end-use sectors.
Key Insights:- China is expected to dominate by 2035.
| Company | Latest Revenue (NTD Billion) |
| Formosa Plastics Group | 1,927.9 |
| Formosa Plastics Corporation | 175.4 |
Source: Precedence Research Database (as supplied)
Formosa Plastics Group generated NTD 1927.9 billion in revenue recently. The subsidiaries, such as Formosa Plastics Corp, Formosa Chemicals & Fibre Corp, Formosa Petrochemical Corp, and Nan Ya Plastics Corp, contribute to the revenue. Factors like advanced electronic materials, manufacturing relocation to Southeast Asia, and digital transformation drive the revenue growth. Formosa Plastics Corporation generated NTD 175.4B in revenue. Factors like semiconductor supply chains, adjustments in energy costs, and AI integration support revenue generation.
Source: Precedence Research Database (as supplied)
Source: Precedence Research Database (as supplied)
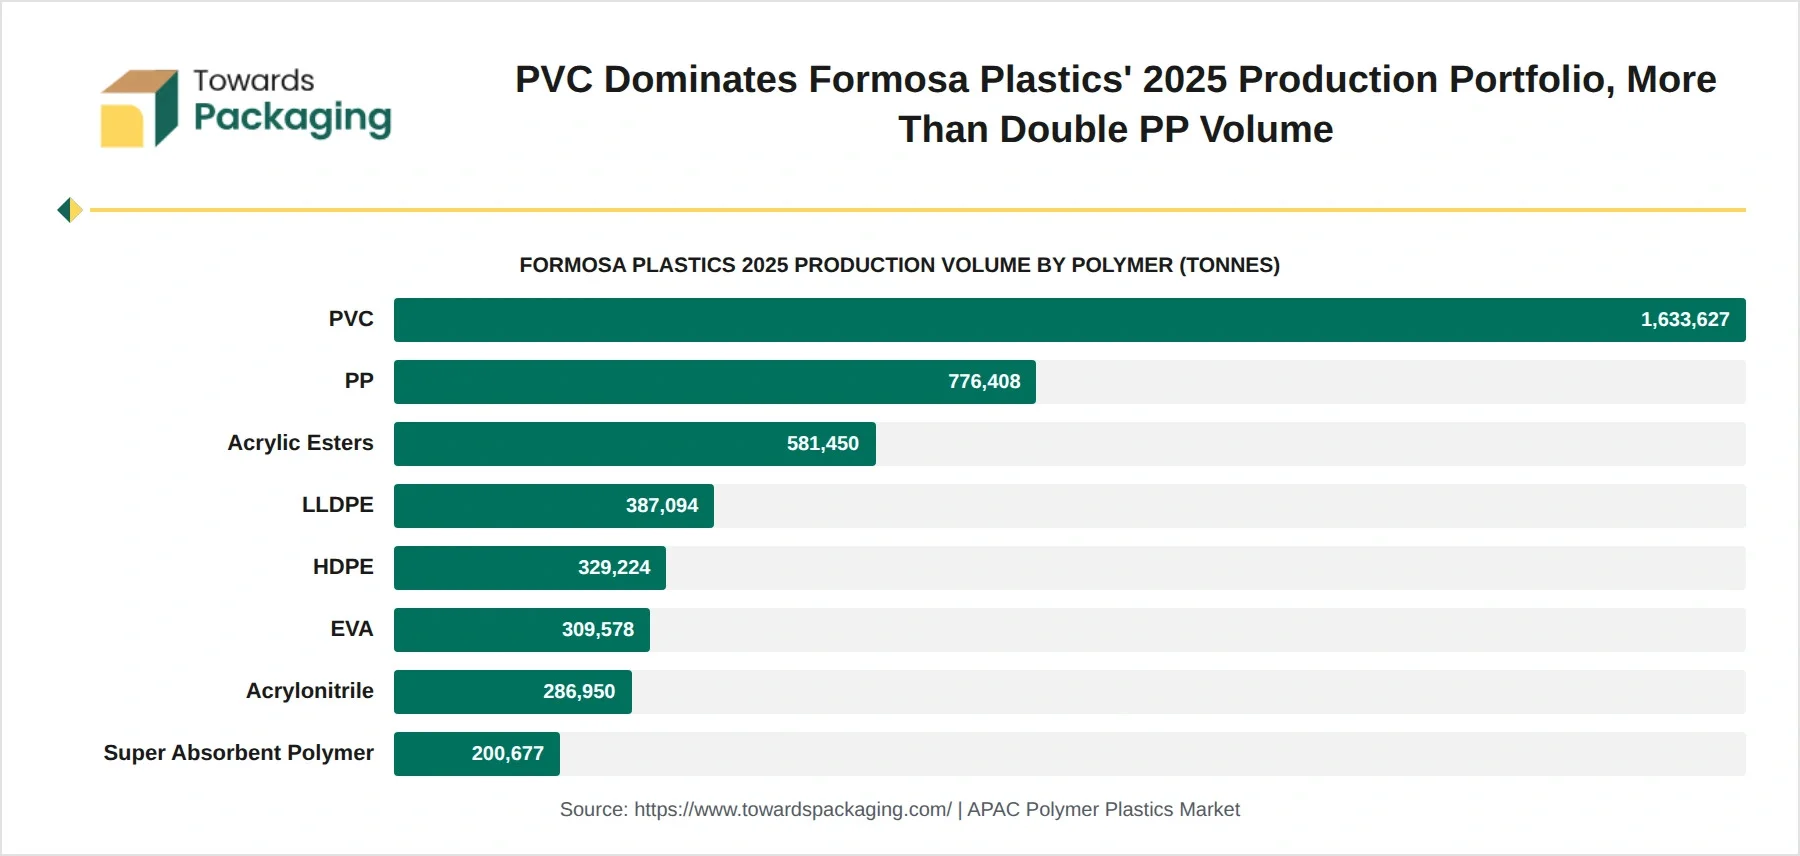
The company's PVC production volume is more than double that of PP. The company produced 1633627 tonnes of PVC. It generates higher PVC due to vertical integration and plant expansions. PP production volume is 776408 tonnes due to advanced production technology. Acrylic esters production volume is 561450 tonnes due to production facilities like the Ningbo Complex and the Mailiao Mega-Complex. LLDPE production volume is 387094 tonnes. HDPE production volume is 329224. EVA production volume is 309578 tonnes. Acrylonitrile production volume is 286950 tonnes. Super absorbent polymer production volume is 200677 tonnes.
Source: Precedence Research Database (as supplied)
Formosa Plastics' PVC sales were 1,629,156 tonnes in 2025 due to the production expansion and government projects. The PP sales were 776013 tonnes due to the presence of advanced JPP technology, and acrylic esters sales were 548462 tonnes in 2025. The LLDPE sales were 411714 tonnes, and EVA sales were 324331 tonnes in 2025. Formosa Plastics' HDPE sales were 321310 tonnes in 2025. Formosa Plastics’ acrylonitrile sales were 278843 tonnes, and super absorbent polymer sales were 202008 tonnes in 2025.
Source: Precedence Research Database (as supplied)
HDPE sales of the company increased by 14.7% due to regional production expansion. The rising sales in Bangladesh and Vietnam are responsible for the increase in HDPE sales. EVA sales increased by 2.7% due to downstream manufacturing and the explosion of solar energy. MMA sales increased by 3.2% due to PMMA growth and the explosion of architectural projects. PP sales decreased by 7.5% due to lower product cost and Chinese surplus capacity. LLDPE sales decreased by 7.7% due to high overcapacity and weak downstream. Acrylonitrile sales decreased by 1.6% due to regional overcapacity and scheduled facility maintenance.
| Sales Region | Revenue Share (%) |
| Export Markets | 73 |
| Taiwan Domestic Market | 27 |
Source: Precedence Research Database (as supplied)
The Formosa Plastics export market revenue share is 73%. The production of high-margin products and large vertical integration increases export revenue. The strong production hub in Taiwan increases export revenue. Formosa Plastics' Taiwan domestic market revenue share is 27% due to strong production infrastructure for construction materials and electronics. The integrated production sites and supply security drive the growth.
Source: Precedence Research Database (as supplied)
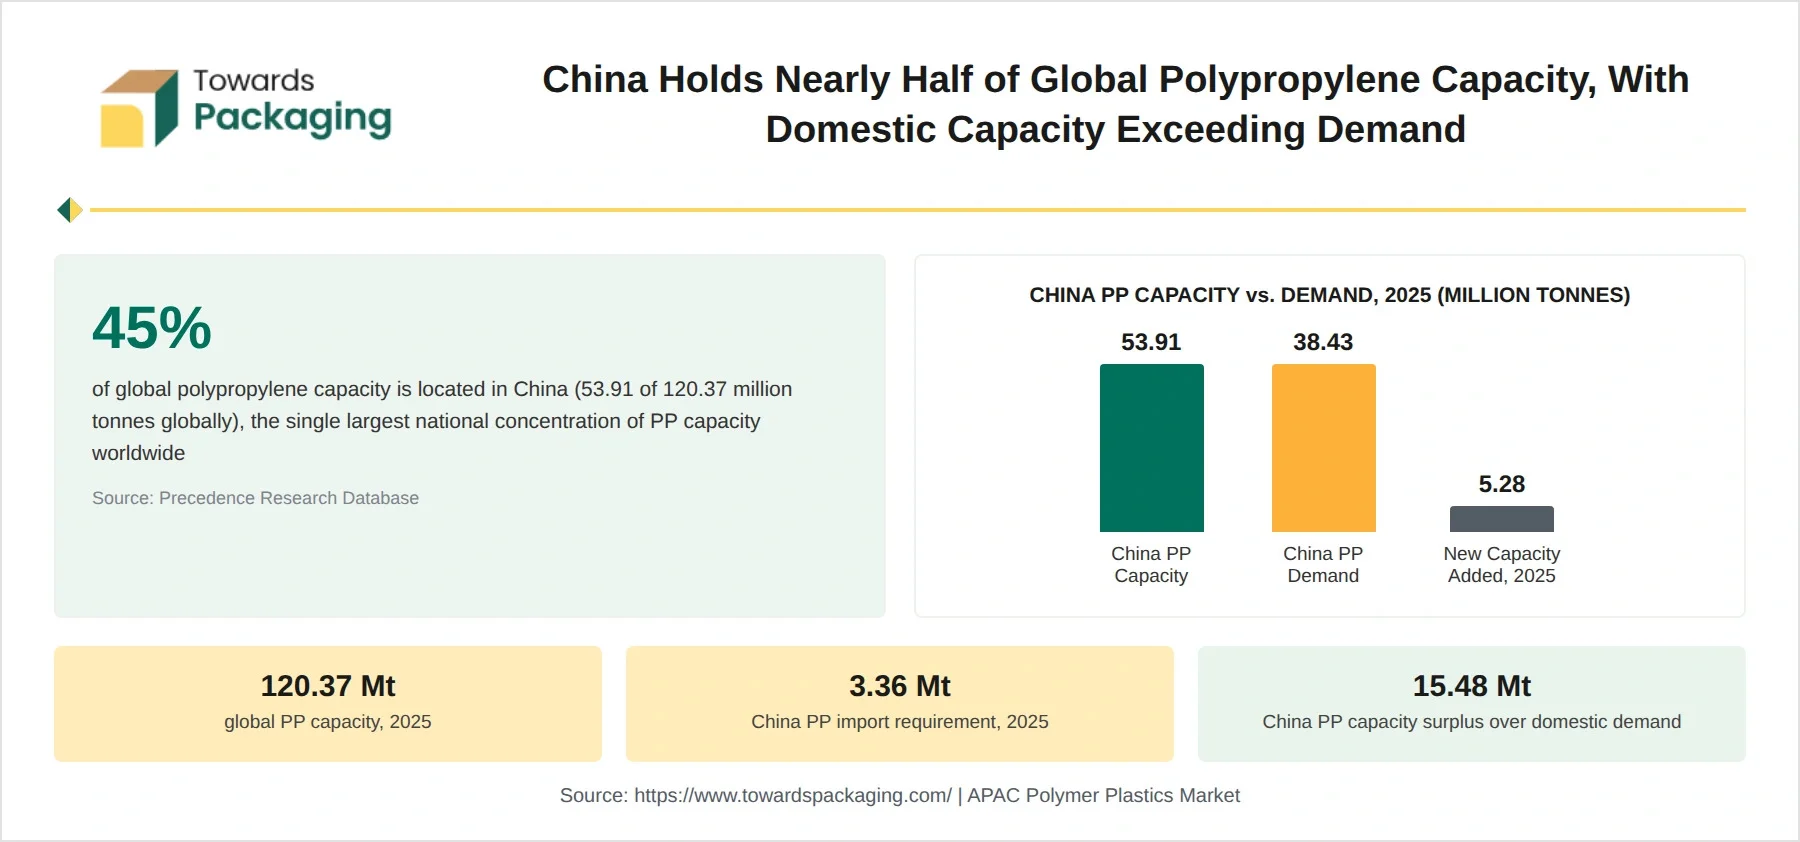
The China PP production capacity was 53.91 million tonnes in 2025. The global PP production capacity was 120.37 million tonnes in 2025. China's PP demand was 38.43 million tonnes in 2025. The newly added PP capacity was 5.28 million tonnes in China in 2025. The PP import volume was 3.36 million tonnes in China in 2025.
Source: Precedence Research Database (as supplied)
China held 45% of the global polypropylene capacity in 2025. The global capacity for PP production was 120.37 million tonnes in 2025. The overall PP production capacity in China was 53.91 million tonnes, and overall PP demand in China was 38.43 million tonnes in China in 2025. The expanded production capacity was 5.28 million tonnes. China PP demand growth drivers are lightweighting needs, the automotive industry, and packaging demand.
Key Insights:- China held a 45% share in global PP capacity.
| Region | Share (%) |
| China | 45 |
| Rest of World | 55 |
Source: Precedence Research Database (as supplied)
Other countries, other than China, held a 55% share in the PP production capacity. China held a 45% share in the global PP capacity. China held a massive share due to robust capacity additions, availability of local feedstocks, massive industrial growth, and vertically integrated infrastructure. The country uses PP in applications like automotive components, household goods, packaging, and home appliances. It has high self-sufficiency and low local cost.
Asia-Pacific PP Company Portfolio
| Rank | Company |
| 1 | Sinopec |
| 2 | Reliance Industries |
| 3 | Formosa Plastics |
| 4 | Mitsubishi Chemical |
| 5 | Mitsui Chemicals |
| 6 | Sumitomo Chemical |
| 7 | LG Chem |
| 8 | SK Geo Centric |
| 9 | PetroChina |
| 10 | Indian Oil Corporation |
| 11 | LyondellBasell |
| 12 | ExxonMobil |
| 13 | SABIC |
| 14 | Dow |
| 15 | Borealis |
Source: Precedence Research Database (as supplied)
| Company | APAC Countries Presence |
| Sinopec |
Singapore Japan Thailand Hong Kong Australia Bangladesh |
| Reliance Industries |
India Singapore South Korea |
| Formosa Plastics |
Taiwan Vietnam Indonesia Mainland China Philippines |
| Mitsubishi Chemical |
India Philippines Singapore Indonesia Thailand Vietnam |
| Mitsui Chemical |
Singapore Indonesia South Korea Thailand Malaysia |
| LG Chem |
Thailand India Indonesia Singapore China Vietnam Malaysia Japan |
| SK Geo Centric |
China Singapore South Korea |
| PetroChina |
Singapore Hong Kong Thailand Indonesia |
| Indian Oil Corporation |
Sri Lanka Singapore Nepal Bangladesh Thailand |
| LyondellBasell |
China Malaysia Thailand Japan Indonesia South Korea India Singapore |
| ExxonMobil |
Australia Hong Kong Malaysia Singapore China Indonesia New Zealand |
| Company | Headquarters/Major APAC Base | Core Polymer Focus |
| Sinopec | China | PE, PP, engineering plastics |
| PetroChina | China | Polyolefins, petrochemicals |
| Reliance Industries | India | PE, PP, polyester |
| Indian Oil | India | PP, PE |
| Formosa Plastics | Taiwan | PVC, PE, PP |
| LG Chem | South Korea | ABS, polyolefins, engineering plastics |
| SK Geo Centric | South Korea | Polyolefins |
| Mitsubishi Chemical | Japan | Engineering polymers |
| Mitsui Chemicals | Japan | PP, engineering plastics |
| Sumitomo Chemical | Japan | Advanced polymers |
Source: Precedence Research Database (as supplied)
Source: Precedence Research Database (as supplied)
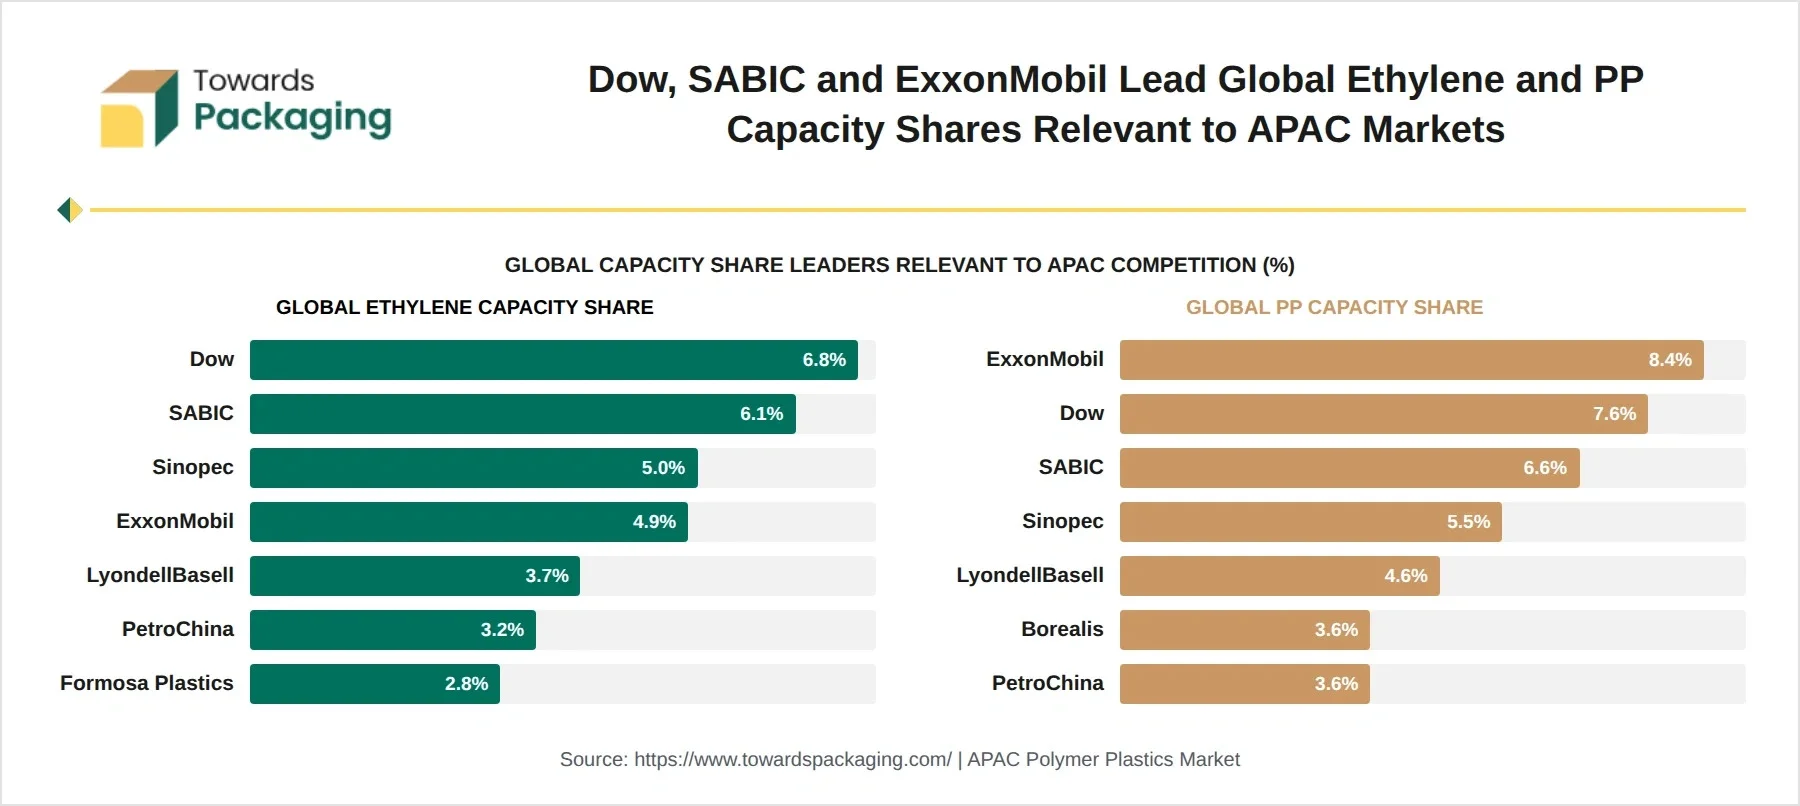
Dow held a 6.8% share in the global ethylene capacity due to the high APAC demand and strong manufacturing sites. SABIC held a 6.1% share in the global ethylene capacity due to robust strategic joint ventures. Sinopec held a 5% share in the global ethylene capacity. ExxonMobil held a 4.9% share in the global ethylene capacity. LyondellBasell held a 3.7% share, PetroChina held a 3.2% share, and Formosa Plastics held a 2.8% share in the global ethylene capacity.
ExxonMobil held an 8.4% share in the global PP capacity due to regulatory-approved capacity and advanced technologies. Dow held a 7.6% share in the global PP capacity. SABIC held a 5.6% share in the global PP capacity. Sinopec held a 5.5% share in the global PP capacity. LyondellBasell held a 4.8% share, Borealis held a 3.6% share, and PetroChina held a 3.5% share in the global PP capacity.
Key Insights:- ExxonMobil held an 8.4% share in the global PP capacity.
Competitive positioning depends on global polymer capacity
Source: Precedence Research Database (as supplied)
Source: Precedence Research Database (as supplied)
| Metric | 2026 Volume (Million Tonnes) |
| China PE Production Capacity | 40.22 |
| China PE Demand | 41.47 |
Source: Precedence Research Database (as supplied)
The PE production capacity of China is 40.22 million tonnes in 2026. Factors like self-sufficiency targets, high domestic consumption, energy transition, and integrated industrial hubs increase China’s PE production capacity. The PE demand in China is 41.47 million tonnes. China's PE demand is growing due to a higher need for packaging materials and the manufacturing of industrial goods.
| Metric | 2025 Volume (Million Tonnes) |
| Global PE Capacity | 156.04 |
| Global PE Surplus Capacity | 32.45 |
Source: Precedence Research Database (as supplied)
The global PE production capacity is 156.04 million tonnes in 2025. The global PE capacity is growing due to the increasing middle-class consumption, feedstock benefits, high material utility, and rapid industrialization. The global PE surplus capacity is 32.45 million tonnes due to the expanding production in China and increasing consumption in APAC regions.
| Market | PVC Demand 2025 (Million Tonnes) |
| India | 4.40 |
| China | 19.57 |
Source: Precedence Research Database (as supplied)
The PVC demand in India is 4.40 million tonnes. The PVC demand in China is 19.57 million tonnes. Factors like Government sanitation schemes, commercial building developments, and a rise in agricultural irrigation increase PVC demand in India. The PVC demand is expanding due to the development of water supply systems, increased electronics applications, a rise in public works projects, and cost-efficient manufacturing.
| Indicator | Formosa Plastics | Sinopec | PetroChina | Reliance Industries |
| Revenue Data Available | 175.4 | Not disclosed | Not disclosed | Not disclosed |
| PVC Production (Tonnes) | 1,633,627 | Not disclosed | Not disclosed | Not disclosed |
| PP Production (Tonnes) | 776,408 | Not disclosed | Not disclosed | Not disclosed |
| HDPE Production (Tonnes) | 329,224 | Not disclosed | Not disclosed | Not disclosed |
| EVA Production (Tonnes) | 309,578 | Not disclosed | Not disclosed | Not disclosed |
| Export Sales Share (%) | 73 | Not disclosed | Not disclosed | Not disclosed |
Source: Precedence Research Database (as supplied)
Formosa Plastics generated NTD 175.4B in revenue. The company produced 1633627 tonnes of PVC. They produced 776408 tonnes of PP. The company produced 329224 tonnes of HDPE. The total EVA production of the company is 309578 tonnes. The company held a 73% share in the export sales.
According to my research, the Asia-Pacific Polymer Plastics Market is growing at a notable rate. Growth factors like strategic partnerships between companies, demand for high-performance materials, thriving manufacturing activities, and green innovations drive the growth. India is growing with the fastest CAGR during the forecast period. Thermoplastics held a major share in the market in 2025. Top players like LG Chem, Teijin Limited, Formosa Plastics, Dow, Mitsubishi Chemical, and Asahi Kasei support the growth.
Vidyesh Swar researched primary things like Asia-Pacific Polymer Plastics Market CAGR, segmental shares, market value 2025 & 2035, and country current & forecasted shares.
Aman worked on revenue scale, production capacity, polymer sales, PP production capacity, leading players, and APAC PP Leading companies.
Aditi verified inconsistencies in the report, verified overall findings, corrected factual errors, and made the report ready for publication.
By Polymer Type
By Product Type
By Form
By Processing Technology
By Application
By End-Use Industry
By Country
Towards Packaging Analytics & Consulting - Asia-Pacific Polymer Plastics Market: market sizing, CAGR, and full segmentation tables (Polymer Type, Product Type, Form, Processing Technology, Application, End-Use Industry, Country), 2025-2035.
Precedence Research Database (as supplied) - company-level competitive intelligence: revenue scale, Formosa Plastics production/sales volumes and growth rates, export sales share, China polypropylene capacity/demand statistics, APAC polypropylene company ranking, company manufacturing presence, global ethylene and polypropylene capacity shares, China/global polyethylene capacity and demand, India/China PVC demand.



















Principal Research Analyst
Vidyesh Swar is a Senior Research Analyst at Towards Packaging, bringing over 4 years of dedicated expertise in market intelligence and strategic analysis across the dynamic world of packaging technologies and solutions.
Learn more about Vidyesh Swar

Reviewed By
Aditi Shivarkar, with 14+ years in packaging market research, specializes in food, beverage, and eco-friendly packaging. She ensures accurate, actionable insights, driving Towards Packaging Analytics & Consulting 's excellence in industry trends and sustainability.
Learn more about Aditi Shivarkar


Asia-Pacific Polymer Plastics Market
 Table of Content

 Download Sample
 Schedule a Meeting