


According to Vidyesh Swar, who has 5+ years of experience in the packaging sector. His research showcases growth opportunities in the reusable shipping packaging market. The global reusable shipping packaging market size was valued at $9.35B in 2025 and is expected to grow at a CAGR of 11.20% during the forecast period. The market is projected to reach $27.03B by 2035. Factors like expanding cross-border shipping, integration of smart technology, and focus on public green targets support the growth. E-commerce shipping applications dominated the market in 2025. Europe dominated the market with a 32% share in 2025. Companies like Brambles Limited, ORBIS Corporation, Greif Inc., and IFCO Systems are major contributors.
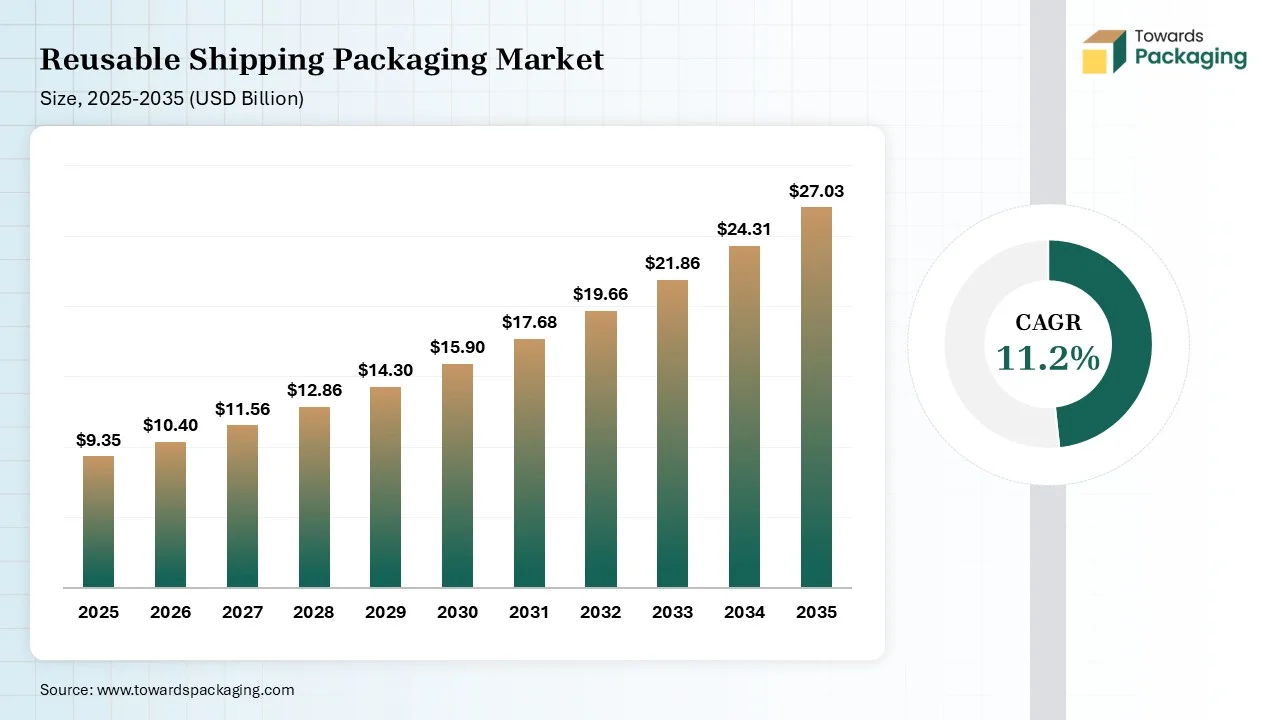
Reusable shipping packaging is a strong shipping solution developed for multiple journeys. Its characteristics include excellent weather resistance, closed-loop compatibility, standardized sizing, EOL recyclability, and exceptional material strength. Its benefits are long-term savings, low emissions, and minimized product damage rates. Reusable shipping packaging includes rigid plastic boxes, collapsible bulk containers, steel drums, reusable mailers, returnable pallets, transport crates, and metal racks. The global reusable shipping packaging market size was estimated at $9.35B in 2025. The high e-commerce volume, companies' focus on public sustainability targets, interest in tough reusable containers, expansion of durable shipping loops, and the transition away from thin plastic films increase the use of reusable shipping packaging. Europe is leading the market in 2025. The leading contributors are IFCO Systems, Schoeller Allibert, Brambles Limited, and ORBIS Corporation.
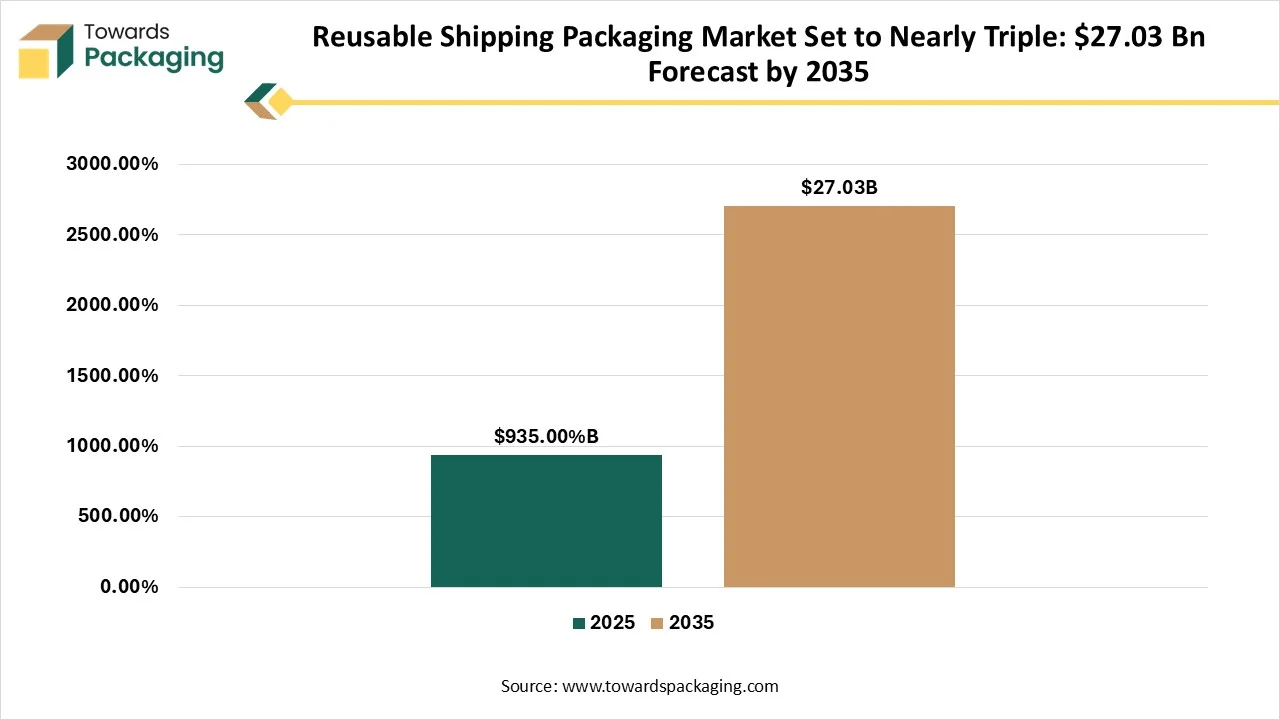
The global reusable shipping packaging market is predicted to reach $27.03 by 2035. Factors like taxes on waste-heavy packaging, ESG targets in manufacturing brands, cross-border boom, high utilization of reusable plastic crates, reductions in recurring packaging sourcing, ease of recirculating shipping containers, avoidance of excessive delivery trash, and advancements like reinforced paperboard help market growth. Key growth drivers are e-commerce logistics and pooling services. Top industry players are Rehrig Pacific Company, Brambles Limited, and Scholler Allibert, will contribute to the growth.
The market reached $9.35B in 2025 and is expected to grow at an 11.20% CAGR during the forecast period. The market is expected to reach $10.4B by 2026 and $11.56B by 2027. The market is expected to reach $12.86 by 2028 and $14.3B by 2029. The market is expected to reach $15.9B by 2030 and $17.68B by 2031. The market is expected to reach $19.66B by 2032 and 21.86B by 2033. The market is expected to hit $24.31B by 2034 and $27.03B by 2035. Factors include managing the entire product, interest in durable transport assets, digital tracking trends, and expansion of outsourced services, supports the growth.
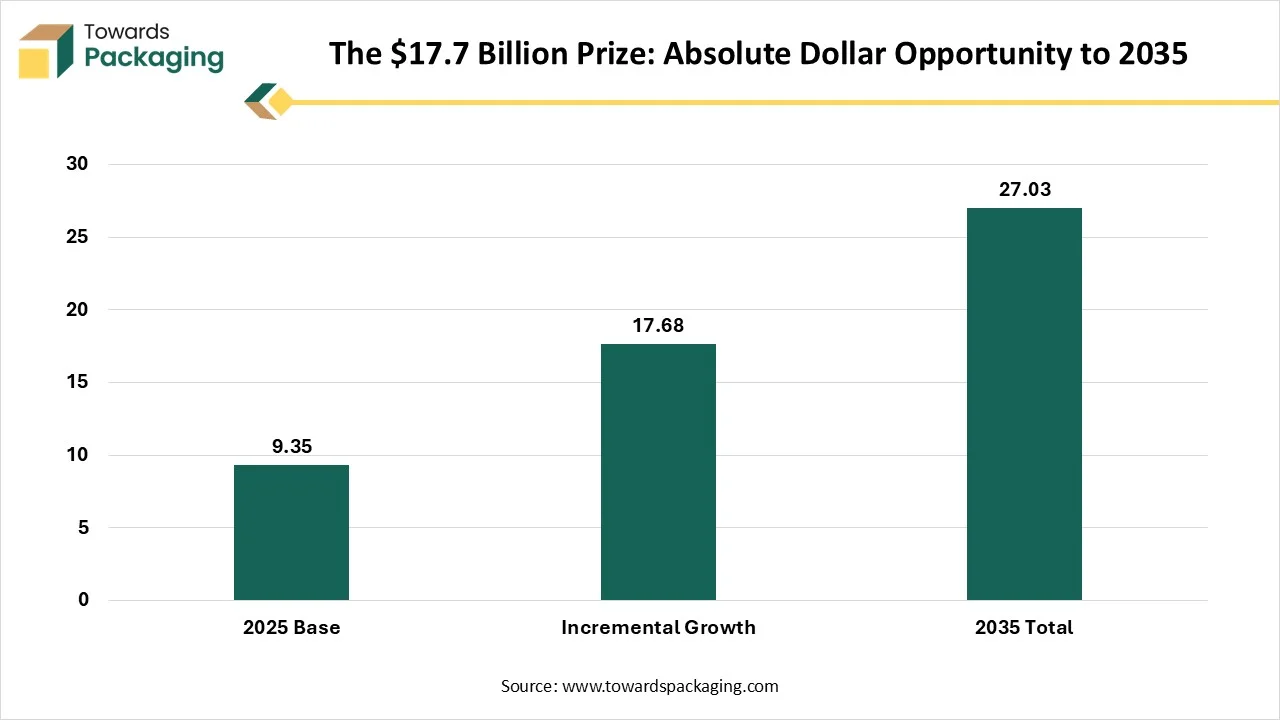
The calculated incremental growth of the reusable shipping packaging market is $17.6B during 2025-2035. Key growth drivers are the explosion of EPR mandates, expansion of multi-trip mailers, surge in smart asset tracking, rise in closed-loop frameworks, innovations in lightweight engineering polymers, expanding 3PL providers, growing heavy battery transport, burgeoning insulated reusable totes, and focus on lowering visible waste.
The global domestic parcel volume was 9.2B items in 2012. The volume reached 24.9B items in 2020. The global domestic parcel volume is estimated at 27.7B items in 2021. The market volume grew by 3X in 2021 compared to 2012. The market grew by 11.5% in 2020 compared to 2012. The domestic parcel volume increased year-over-year. The international parcel volume fell sharply in the period. The global domestic parcel volume growth was driven by continued lockdowns, transition to permanent online shopping, expanded capacity in smaller delivery networks, and increased spending on low-cost items.
Source:- Universal Postal Union (UPU), State of the Postal Sector 2023 / UPU Postal Statistics
Article 24 of the EU PPWR regulation describes general minimization principles. Article 24 came into force on 12 August 2026. The article minimizes empty space in e-commerce packaging, grouped packaging, and transport packaging. The maximum ratio allowed by the article is 50%. Materials like foam, bubble wrap, wood wool, sponge fillers, air pillows, and air cushions are considered empty space. The rule enforcement will start on 1 January 2030. The rule applies across manufacturers, warehouses, 3PLs, distributors, e-commerce retailers, businesses shipping goods, and fulfilment centers.
Source:- European Commission, Packaging and Packaging Waste Regulation (EU) 2025/40, Article 24
The total municipal solid waste generated in the United States was 292.4 million tonnes in 2018. The US municipal solid waste accounted for a 28.1% share in 2021. The total containers and packaging waste generated was 82.2 million tonnes in 2018. The total containers and packaging waste recycled was 44.3 million tonnes. The total containers and packaging waste combusted was 7.4 million tonnes, and the total landfilled was 30.5 million tonnes in 2018. The total containers & packaging recycling rate is 53.9%.
Source:- US Environmental Protection Agency, Advancing Sustainable Materials Management: 2018 Fact Sheet
Reusable food & beverage packaging systems reduce greenhouse gas emission up to 12-69% than single-use packaging. Reusable packaging systems lowers 69% GHG emission and minimize water use by 70%. The minimum GHG emission reduction is 12% with a reusable packaging system. This system offers environmental benefits. The emission reduction depends on the number of rotation cycles, material, and return logistics.
Source:- Peer-reviewed study, published in a Journal of Cleaner Production-indexed publication (ScienceDirect, 2025)
Decentralized return logistics reduces greenhouse gas emissions by 53% compared to centralized reusable mailer models. The emission reduction is driven by shorter transportation routes. The centralized model generates 100% greenhouse gas emissions. The decentralized model produces 47% greenhouse gas emissions. The returnable mailer is a widely adopted packaging option, and it beats corrugated boxes. The returnable mailer produces lower emissions than corrugated boxes.
Source:- Peer-reviewed study, PMC/National Library of Medicine (environmental analysis of returnable e-commerce packaging systems)
IFCO manufactured reusable crates lower carbon dioxide emissions by up to 62% compared to single-use cardboard. According to a 2018 study, IFCO reusable crates lowered emissions by up to 60%. According to a 2024 study, IFCO RPCs reduced emissions by up to 62%. The maximum number of reuse cycles for reusable crates is 120 before recycling. The average carbon footprint has reduced by 10% since 2018. IFCO RPCs are developed for transporting fresh food. The containers offer sustainability, extended shelf life, and space efficiency.
Source:- IFCO Systems, 2024 Comparative Life Cycle Assessment (conducted by Fraunhofer IBP, reviewed by DEKRA)
On 31 January 2025, International Paper announced the strategic acquisition of DS Smith. The acquisition was completed for $7.2 billion. The acquisition is synergies target is $5.14M. The total number of employees in the company is 65000. Both companies operate in more than 30 countries. The acquisition focuses on becoming the dominant sustainable packaging player.
Source:- International Paper, SEC Form 8-K and press release (31 January 2025)
In April 2025, Reusable.com received $3.6M in a seed round. The key investors that participated in the round are Amplify Capital, Emend Vision Fund, StandUp Ventures, and Sandpiper Ventures. The investment supports hardware-enabled SaaS expansion. EU granted a 2 million investment to RePack Company in 2019. In May 2024, RePack was acquired by oceansix. The acquisition happened due to scaling sustainability, lowering single-use waste, and combining the capabilities of RePack & oceansix.
Source:- PR Newswire (22 April 2025); Tracxn and PitchBook company profiles (RePack acquisition, May 2024)
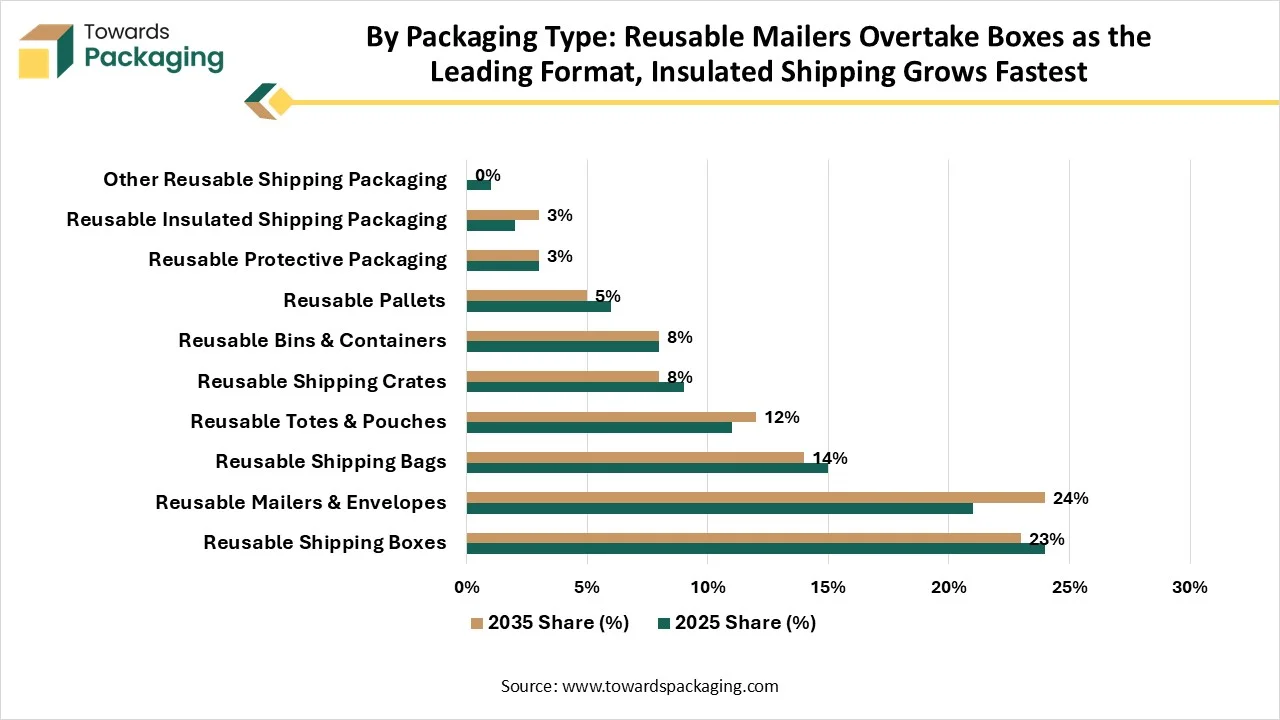
Reusable shipping boxes dominated the reusable shipping packaging industry with a 24% share in 2025. The demand for better item safety and a focus on multi-trip savings increases the use of reusable shipping boxes. The high compatibility with modern conveyor belts helps with expansion. Fewer replacements, reliable stacking, and low labor demand in reusable shipping boxes drive the growth. Reusable mailers & envelopes held a 21% share in the market in 2025. People focus on using the same packaging many times, and the development of stricter laws by the government increases the use of reusable mailers & envelopes. The incorporation of adhesive strips and a focus on small parcel protection increases the use of reusable mailers & envelopes. The rise in dual-seam envelopes drives the growth. Reusable insulated shipping packaging is expected to grow with the fastest CAGR of 15.8% during the forecast period. The high demand for biotechnology products and focus on monitoring interior temperatures increases use of reusable insulated shipping packaging. The thermal control requirements in e-commerce and the need to improve asset recovery increase the use of reusable insulated shipping packaging.
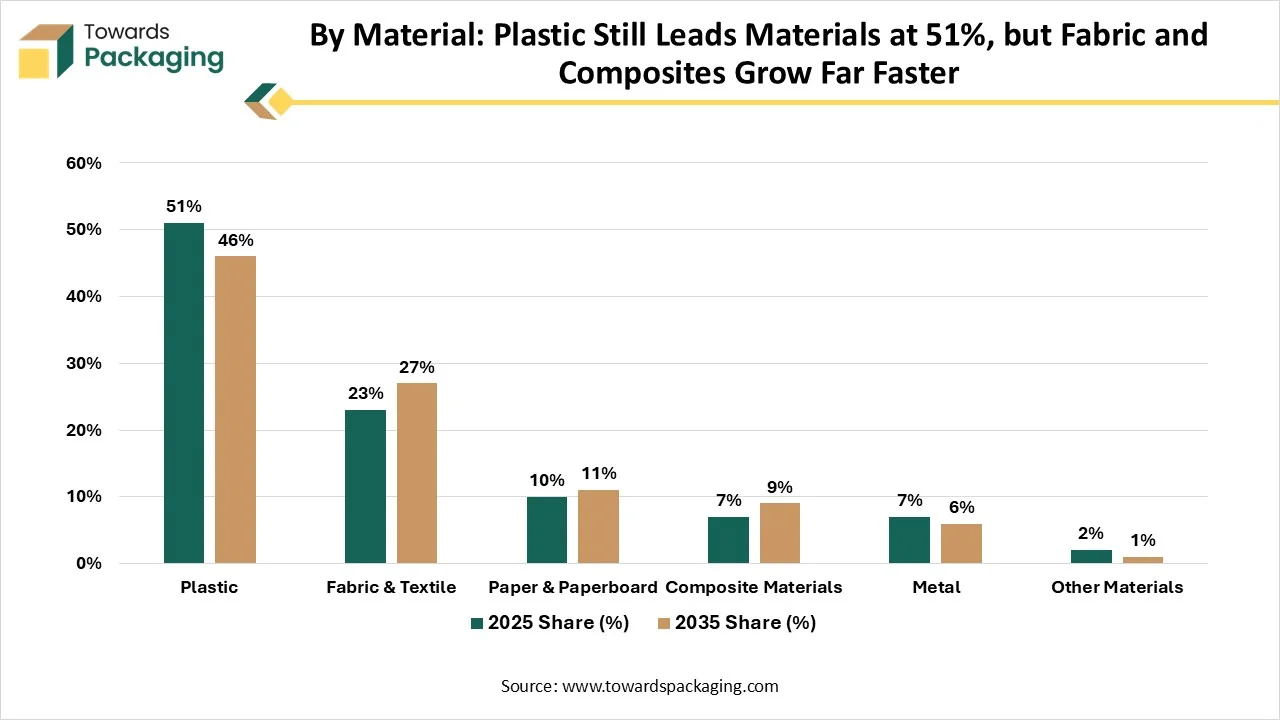
Plastic dominated with a 51% share in the reusable shipping packaging industry in 2025. The zero splintering, lightweight development, and high crushing resistance of plastic help with expansion. The creation of customized crates & totes and a focus on hygienic design increases plastic use. The low maintenance and moisture-proofness of plastic drive growth. Fabric & textile held a 23% share in the market in 2025. Brands' transition to reusable fabric packaging helps with expansion. The demand for material withstand multiple shipping cycles, and interest in lighter containers, increase the use of fabric & textile. Development of returnable packaging mailers increases fabric & textile use. Composite material is growing with the fastest CAGR of 14.1% during the forecast period. The demand for protection in heavy automotive parts and the prevention of moisture degradation increase the use of composite materials. High preference for durable multi-trip solutions and focus on weather safety increase the use of composite materials. The high strength, fuel efficiency, and low total cost of composite materials support the growth.
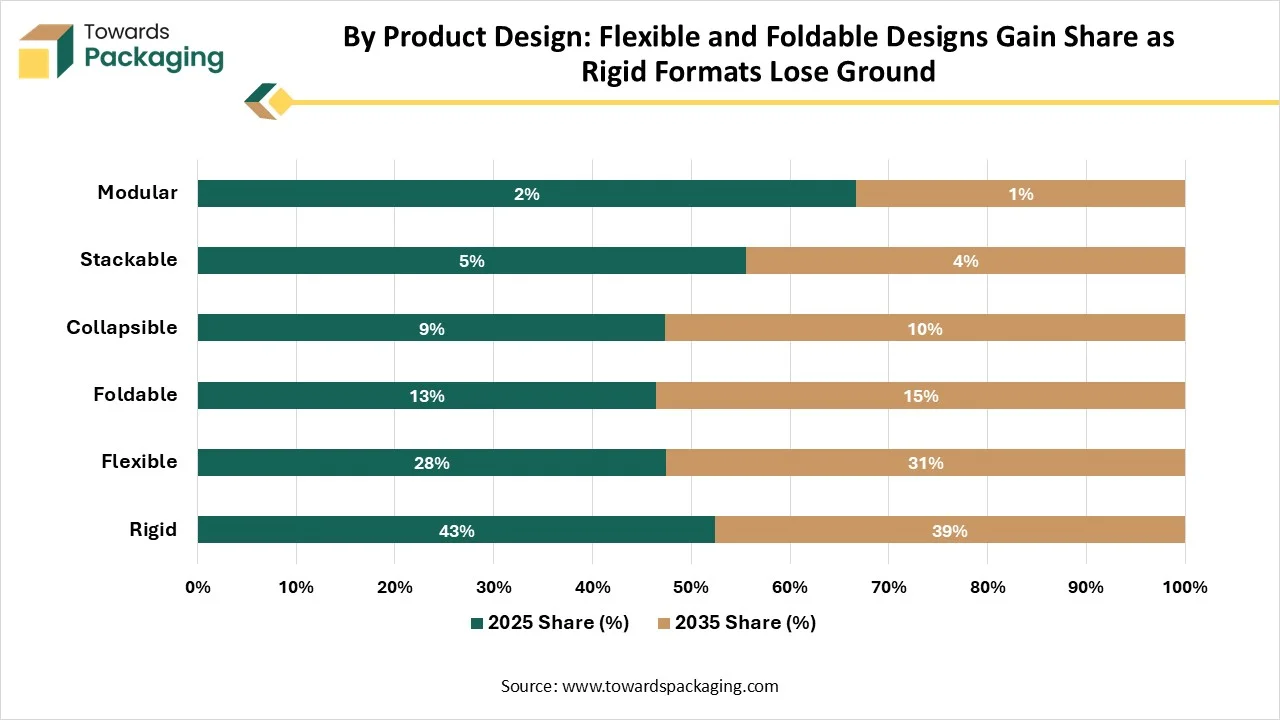
Rigid dominated the reusable shipping packaging industry with a 43% share in 2025. The demand for uniform shapes and requirements for consistent protection increase the use of rigid designs. The easier sanitization, automation friendliness, and excellent stacking strength of rigid designs help with expansion. Their exceptional suitability for closed-loop drives growth. Flexible held a 28% share in the market in 2025. The focus on cutting the volume of return freight and minimizing fuel burn increases the use of flexible design. The maximized payload, conforming shapes, and adjustable dividers in flexible design support the growth. Foldable is expected to grow with the fastest CAGR of 12.9% during the forecast period. The limited floor space in warehouses and the transformation to multi-rotation packaging increase the use of foldable design. The focus on minimizing transport overhead and supply chain automation boosts the overall market growth.
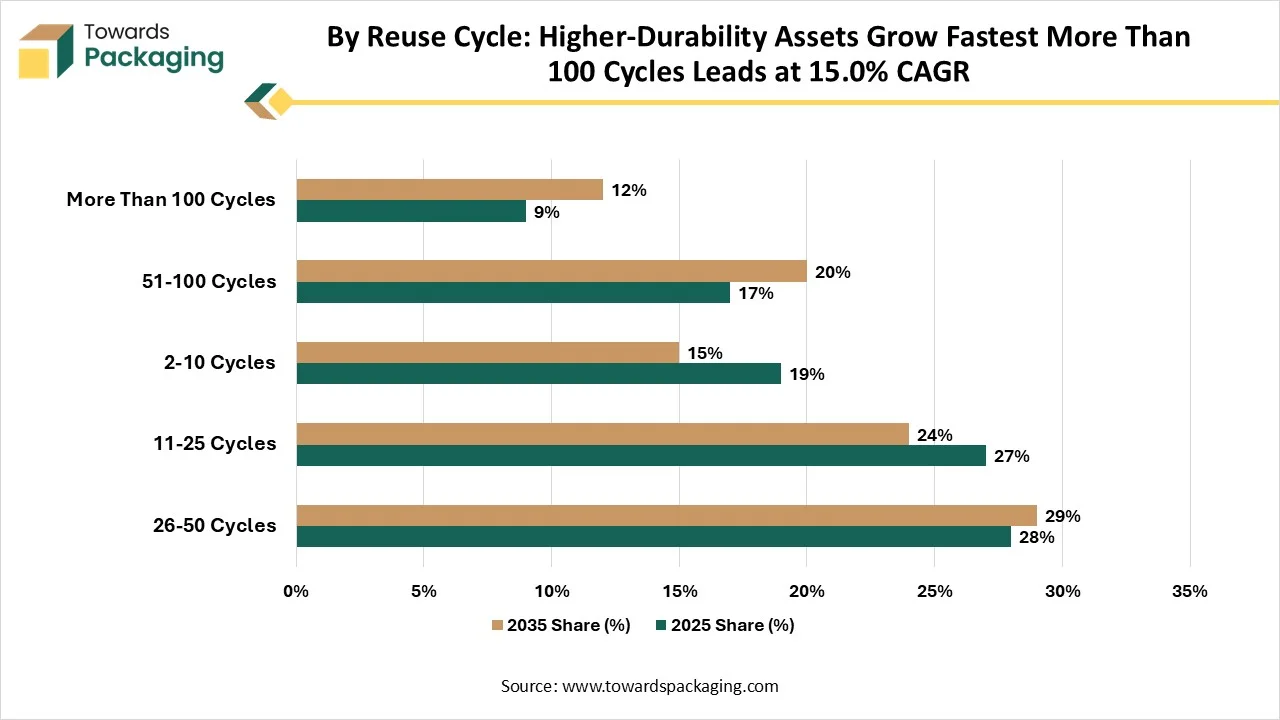
26-50 cycles dominated the reusable shipping market with a 28% share in 2025. The burgeoning reverse logistics activities and higher use of mesh boxes help with expansion. The high capital efficiency, strong material thresholds, amortization balance, and low per-trip cost of 26-50 cycles drive the growth. 11-25 cycles held a 10% share in the market in 2025. The misplacement of boxes by consumers and the focus on easier reverse logistics increase the use of 11-25 cycles. Shrinkage control, washing efficiency, and materials efficiency in 11-25 cycles drive the growth. More than 100 cycles are expected to grow with the fastest CAGR of 15% during the forecast period. The amortized cost and disposal savings in more than 100 cycles help with expansion. The integration of washable polypropylenes and RFID tags in more than 100 cycles helps with growth.
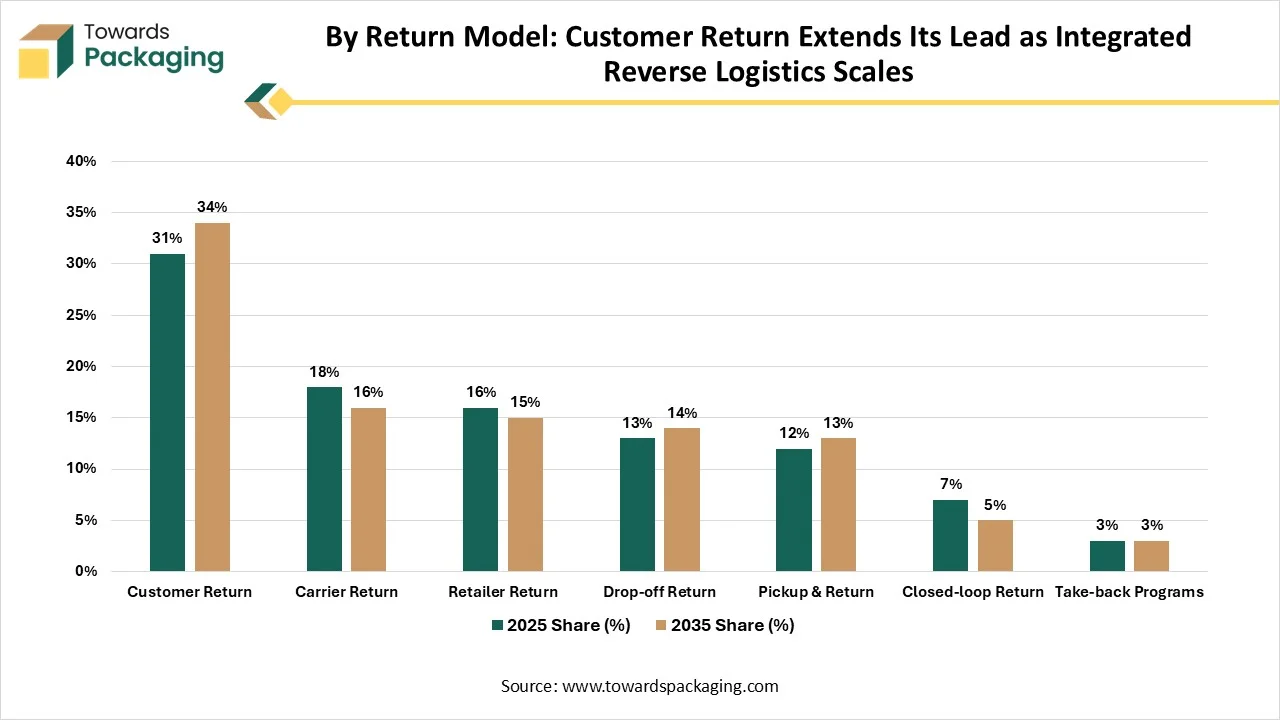
Customer return dominated the reusable shipping industry with a 31% share in 2025 and is expected to grow at the fastest CAGR of 12.3% during the forecast period. Frequent product returns in e-commerce and the availability of drop-off networks across retailers increase the use of customer returns. High returns of apparel and strong parcel reverse journey drive growth. Carrier return held an 18% share in the market in 2025. The increased pickup of collapsible containers and focus on lowering deadhead mileage increase the use of carrier return. Strong logistics providers and high cost optimization in carrier return support the growth. Retailer return held a 16% share in the market in 2025. The high return rates and the shift away from purchasing single-use cardboard increase the use of retailer return. The streamlined sorting, enhanced asset visibility, and high accuracy in retailer returns support the growth.
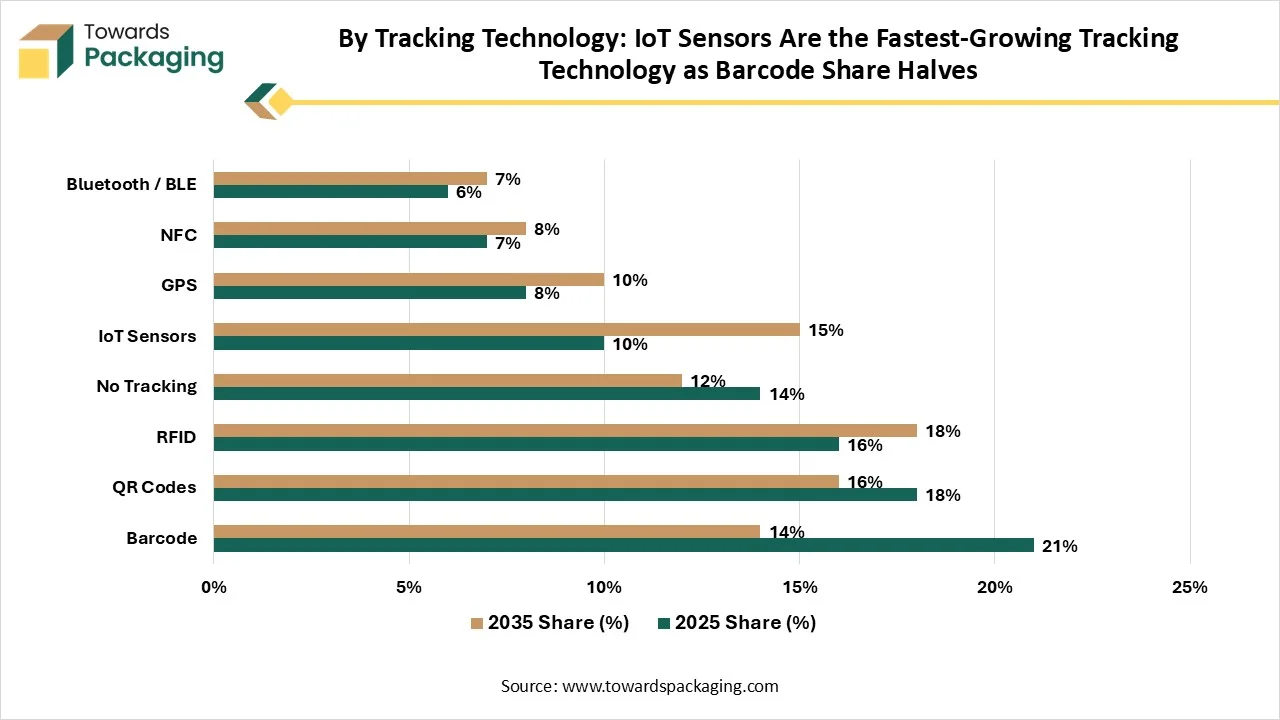
Barcode dominated the reusable shipping packaging market with a 21% share in 2025. The expansion of high-turnover containers and the rise in international shipping carriers increase the use of barcodes. The low investment, error reduction, flawless automation, easy setup, and exceptional durability of barcodes drive the growth. QR codes held an 18% share in the market in 2025. The focus on monitoring brand turnaround trips and the need to improve brand engagement increase the use of QR codes. It provides information about return mailing processes and drop-off points. The smart inventory and dynamic flexibility of QR codes support the growth. IoT sensors are expected to grow with the fastest CAGR of 16% during the forecast period. The need to track exact GPS location and the increased checking of humidity increase the use of IoT sensors. The management of return loops and the need for live data updates increase the use of IoT sensors. Loss reduction and better security in IoT sensors boost growth.
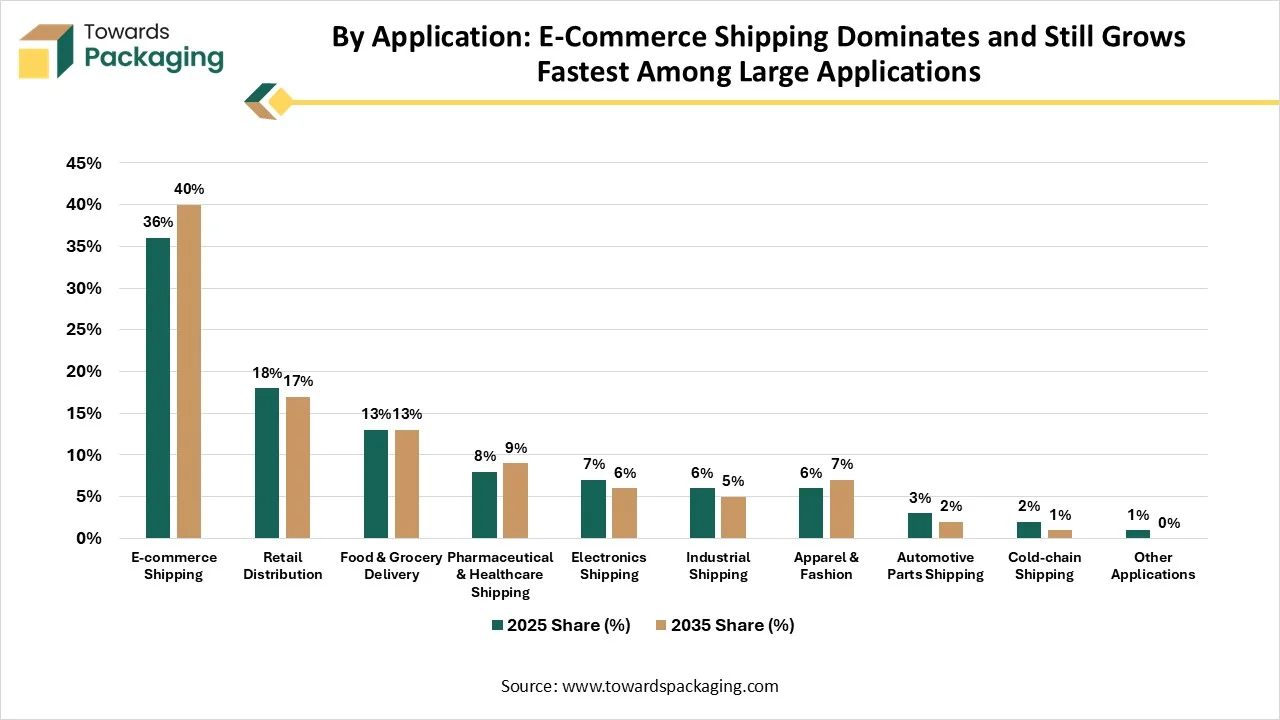
E-commerce shipping dominated the reusable shipping packaging industry with a 36% share in 2025. The high daily parcel deliveries and the need to avoid excess packaging waste increase the use of reusable shipping packaging. E-commerce dependence on returns and increased retailers rewarding helps with expansion. Expanded B2C couriers drive the growth. Retail distribution held an 18% share in the market in 2025. The focus on reducing continuous purchasing of packaging boxes and optimizing loading times increases the use of reusable shipping packaging. Better tracking goals, faster handling, and safe transit in retail distribution support the growth. Apparel & fashion is expected to grow with the fastest CAGR of 12.9% during the forecast period. Shoppers' preference for environmentally-friendly brands and the high expansion of online clothing sales increase the use of reusable shipping packaging. Global fashion brands' commitments and the rise in ordering online fashion items increase the use of reusable shipping containers. Expanding soft apparel items boost the growth.
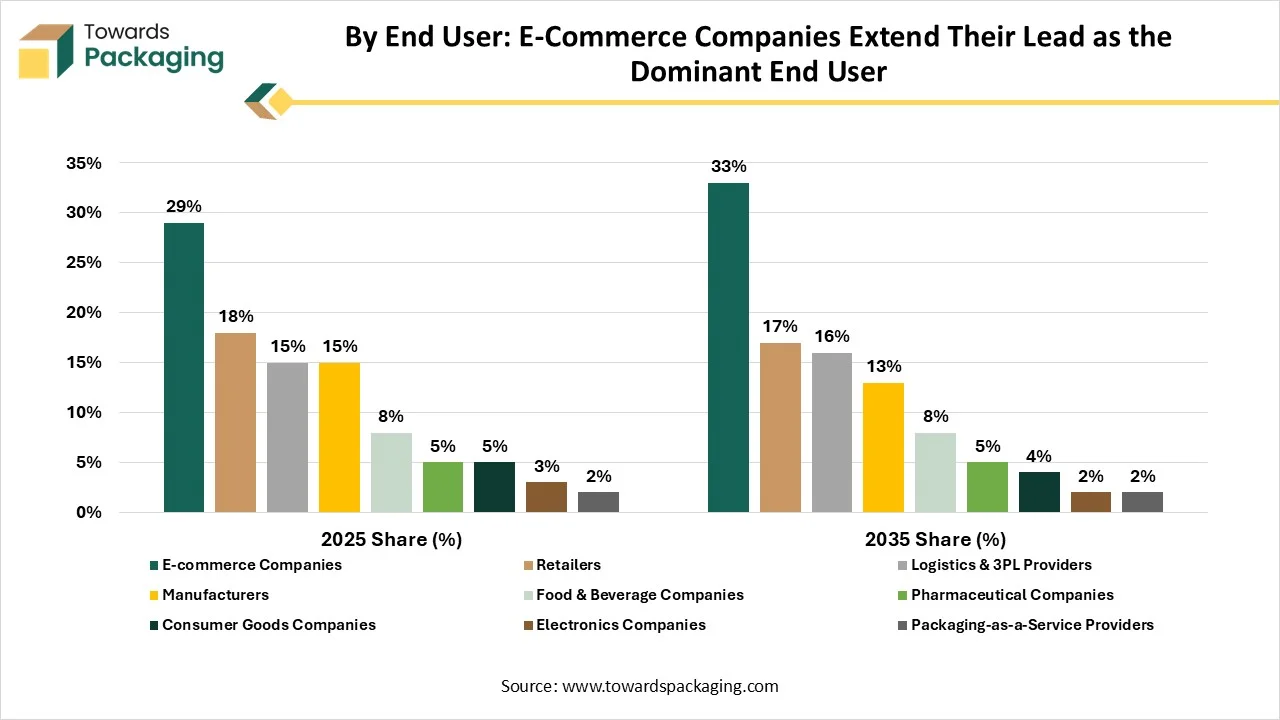
E-commerce companies dominated the reusable shipping packaging market with a 29% share in 2025. E-commerce companies' demand for less waste and resource conservation increases the adoption of reusable shipping packaging. E-commerce companies' focus on enhancing the return process and creating stronger brand loyalty drives the growth. Retailers held an 18% share in the market in 2025. The focus on preventing product weather damage and lowering worker injuries increases the use of reusable shipping packaging. The development of a positive public image and the need to accelerate parcel loading boost the growth. Packaging-as-a-Service providers are expected to grow with the fastest CAGR of 13.4% during the forecast period. The avoidance of purchasing expensive insulated containers and the rise in pay-as-you-go increases adoption of reusable shipping packaging. The demand for easier scaling and the integration of smart tags in PaaS help with the growth.
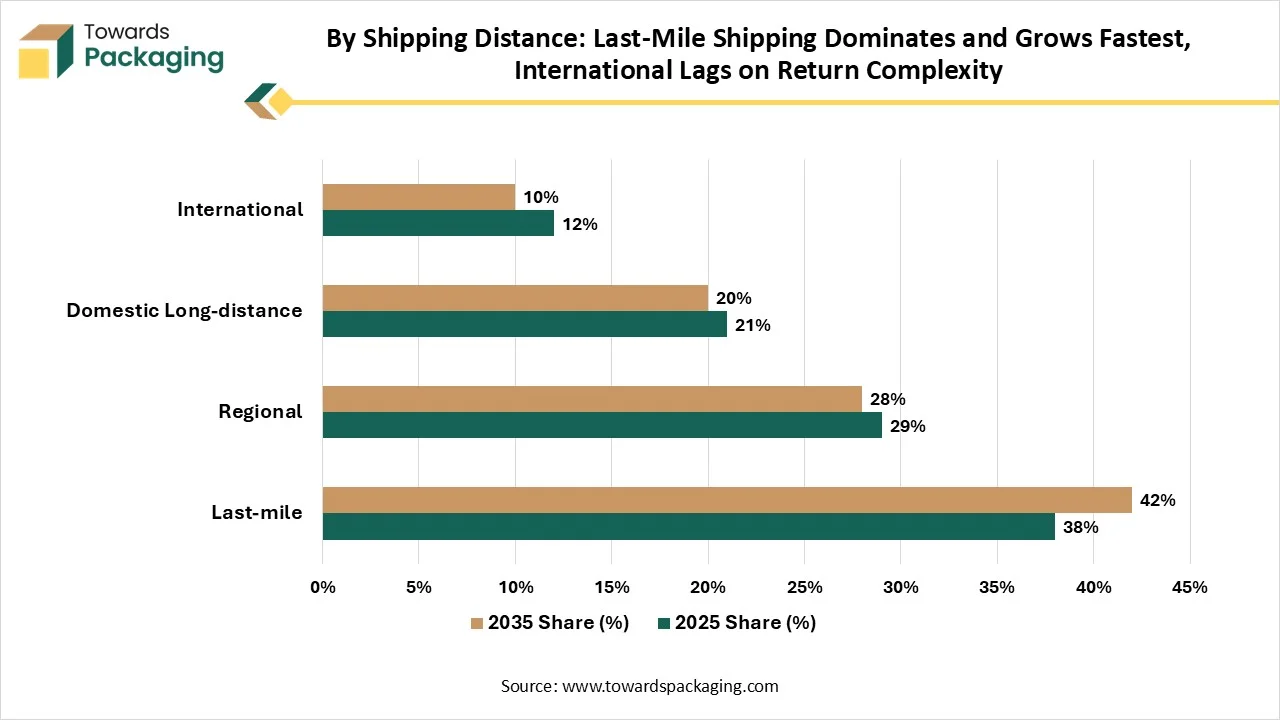
Last-mile dominated the reusable shipping packaging market with a 38% share in 2025 and is expected to grow with a 12.4% CAGR during the forecast period. Last-mile focus on lowering landfill waste and avoiding spending on fresh packaging increases the use of reusable shipping packaging. Last-mile focus on preventing crushed goods and a rise in green business operations increases adoption of reusable shipping packaging. The incorporation of digital routing boosts growth. Regional held a 29% share in the market in 2025. The use of sturdy bins and short regional routes increases use of reusable shipping packaging. The need for better stacking design in regional shipping and the increased following of eco-rules increases the adoption of reusable shipping packaging. The enhanced transport efficiency boosts growth.
Source:- Towards Packaging Database
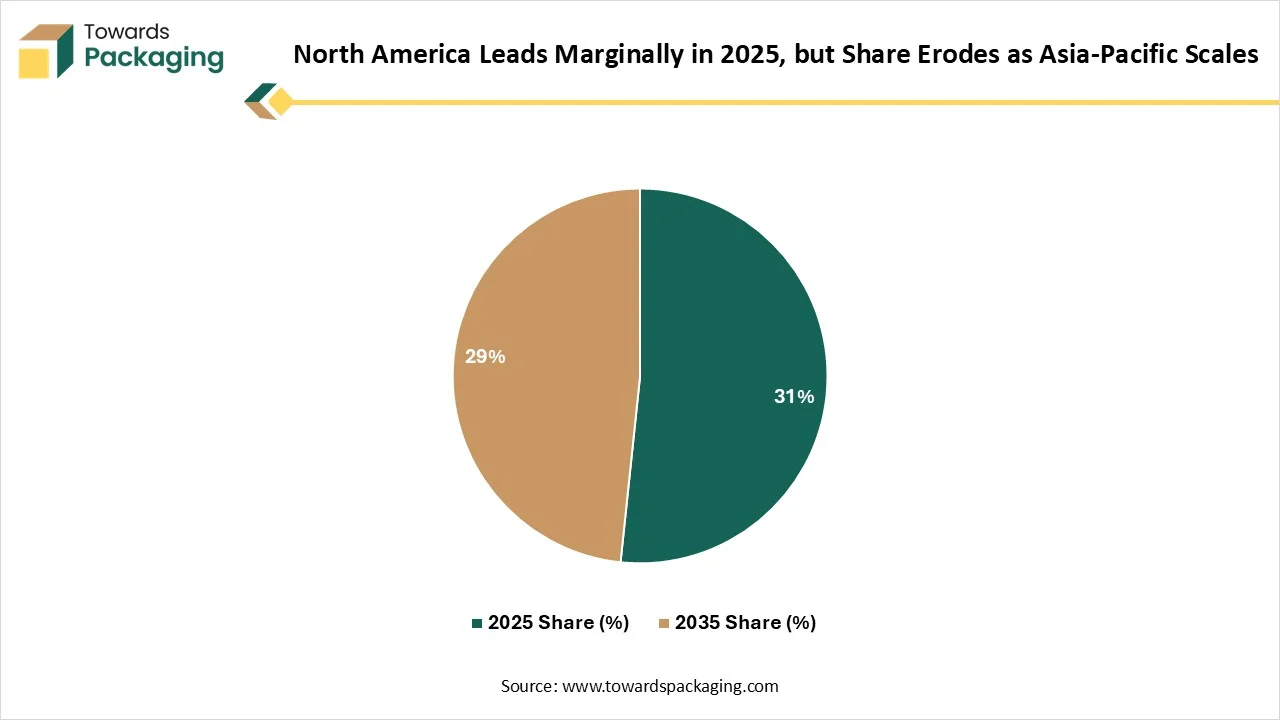
North America held a 31% share in the reusable shipping packaging market in 2025. Brands focus on cutting down packaging waste, and the establishment of new rules increases demand for reusable shipping packaging. The utilization of heavy-duty containers and sensor integration helps with expansion. The reutilization of plastic bins and focus on saving long-term transport costs drive the growth. United States held the largest share in the North America region. High requirements for rigid returnable containers and major beverage brands help with expansion. The focus on minimizing single-use material buying and the need for multi-trip packaging increases the use of reusable shipping packaging. The minimization of replacement expenses supports the growth.
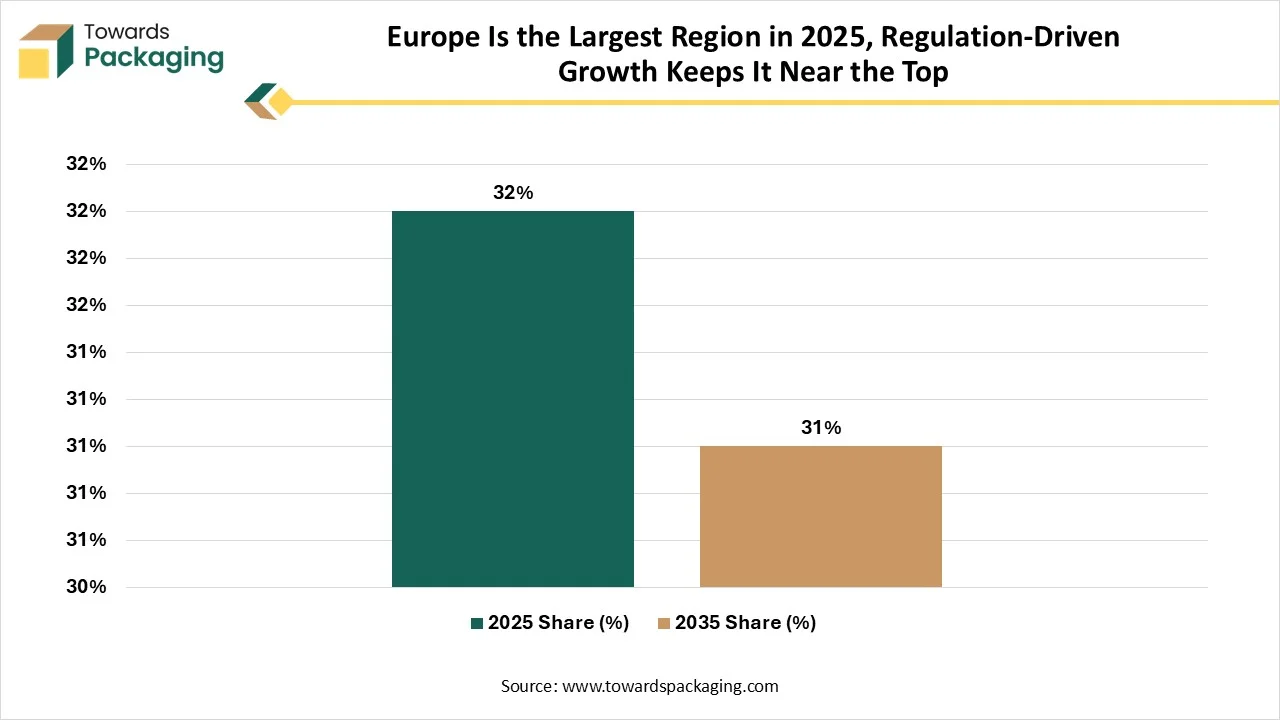
Europe dominated the reusable shipping packaging market with a 32% share in 2025. The stricter European Union policies and focus on minimum reuse levels increase the use of reusable shipping packaging. The penalties on single-use logistics and strong deposit-return systems increase adoption of reusable shipping packaging. Expanded crate pooling networks and advanced IoT tags support the growth. Germany held the highest share in the market in the European region. The stringent waste reduction quotas and laws for take-away sectors increase the use of reusable shipping packaging. A carbon-neutral chain across the manufacturing industry and the integration of RFID tracking systems help with expansion. The mature reverse-logistics infrastructure drives the growth.
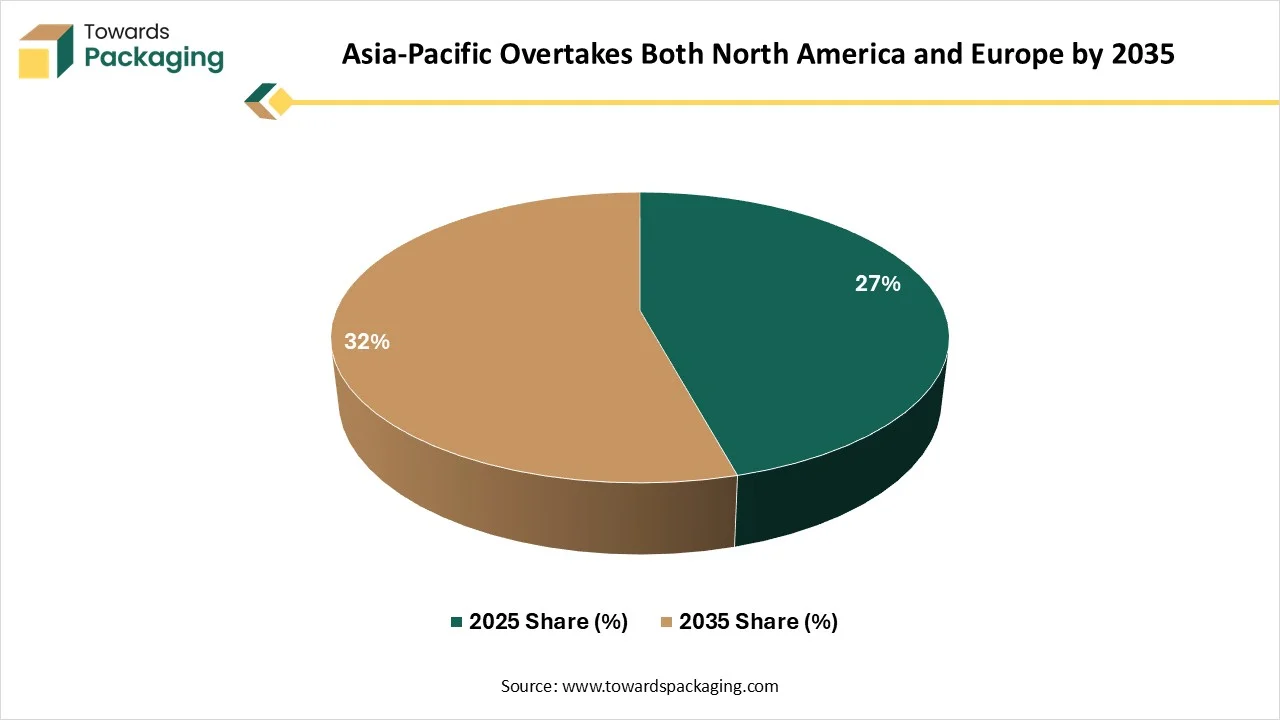
Asia Pacific held a 27% share in the reusable shipping packaging industry in 2025 and is expected to grow with the fastest CAGR of 13.2% during the forecast period. The high home delivery rates across urban areas and tighter recycling targets increase the use of reusable shipping packaging. The heavy manufacturing base and shift away from single-use cardboard increase the adoption of reusable shipping packaging. The growing automotive assembly and expanding food exports boost the growth. China is a key contributor to the market in the region. The Zero-Waste Cities initiatives and the high benchmarks for waste reduction increase the use of reusable shipping packaging. The presence of JD Logistics and demand for stackable plastic trays in the automotive industry increase the use of reusable shipping packaging. Well-established cold-chain pharma supports the growth.
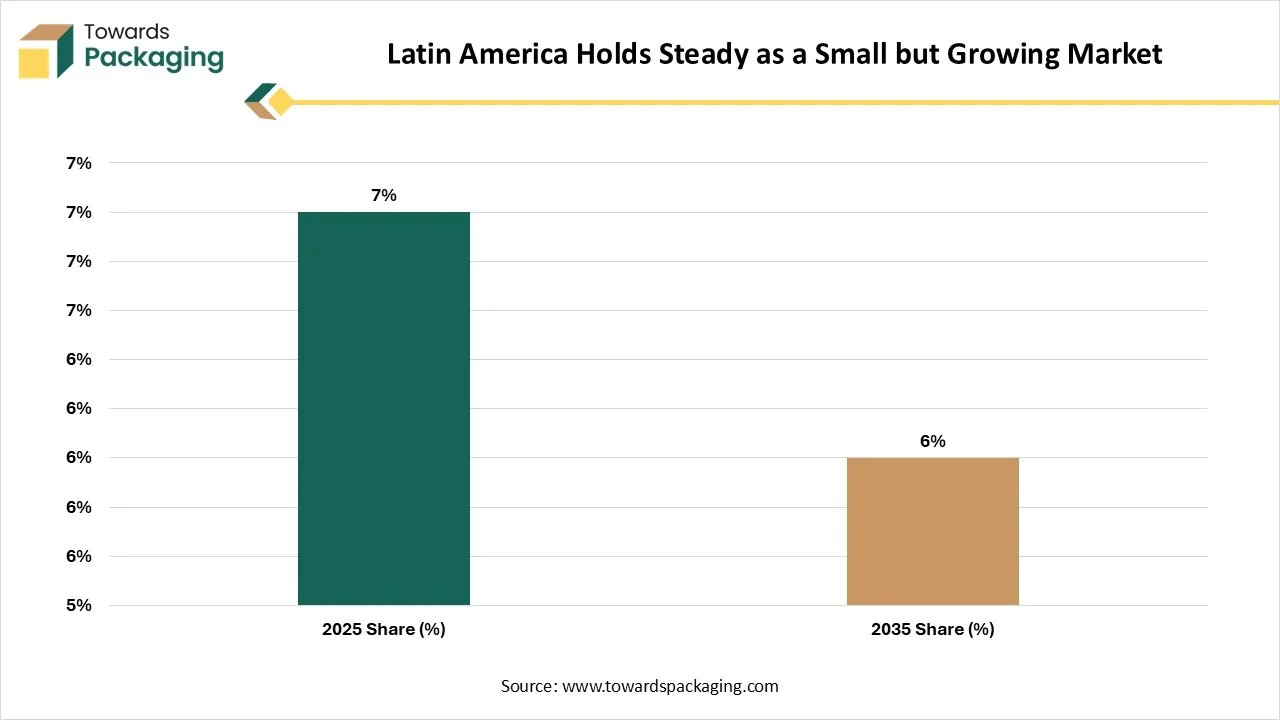
Latin America held a 6% share in the reusable shipping packaging industry and is growing at a 9.5% CAGR during the forecast period. The thriving online retail activities and the expansion of pooling systems increase adoption of reusable shipping packaging. Companies focus on curbing plastic waste, and businesses focus on monitoring shipping assets, which helps with expansion. The thriving cross-border food exports boost growth. Argentina is robustly expanding in the market in the region. The large beef export industry and focus on lowering repetitive purchases of materials increase the use of reusable shipping packaging. Explosive reverse logistics supports the growth.
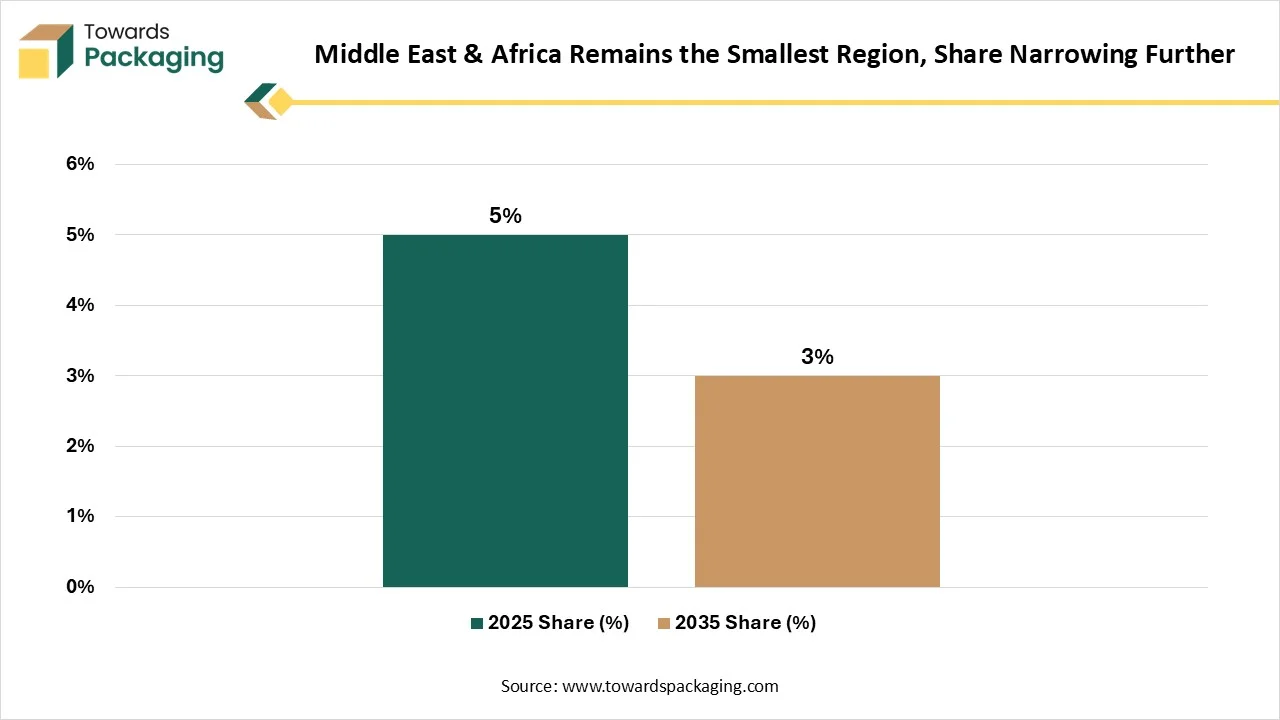
The MEA held a 4% share in 2025 in the reusable shipping packaging industry. Plastic bans in GCC countries and the adoption of RTIs increase the use of reusable shipping packaging. The demand for tertiary transit packaging and exploding supermarket activities increase the use of reusable shipping packaging. The strong chemical manufacturing hubs and harsh transport routes drive the growth. UAE is robustly expanding in the market in the region. The demand for multi-trip packaging alternatives and the presence of operators like Amazon UAE increase adoption of reusable shipping containers. The growing food pooling and the incorporation of tech tracking boost the growth.
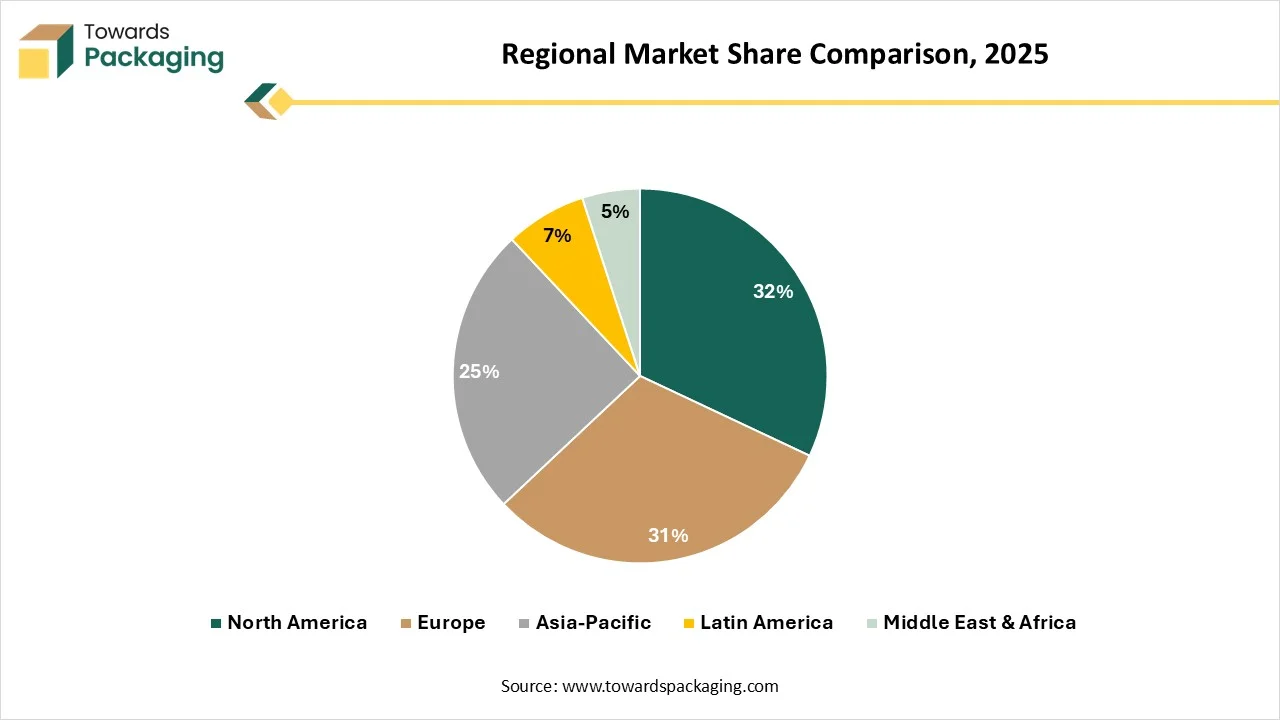
Europe held the highest share of 32% in the reusable shipping packaging industry in 2025 due to cultural norms and integration of reverse logistics across major retailers. North America held a 31% share in the market in 2025 due to the expansion of pooled rental packaging solutions and a strong automotive base. Asia Pacific held a 27% share in the market in 2025 due to heavy industrial manufacturing concentration and transition to multi-trip boxes. Latin America held a 6% share in the market in 2025 due to expanding chemical manufacturing hubs and international food shipping. Middle East & Africa held a 4% share in the market in 2025 due to a fragmented retail industry and slow enforcement of policies.
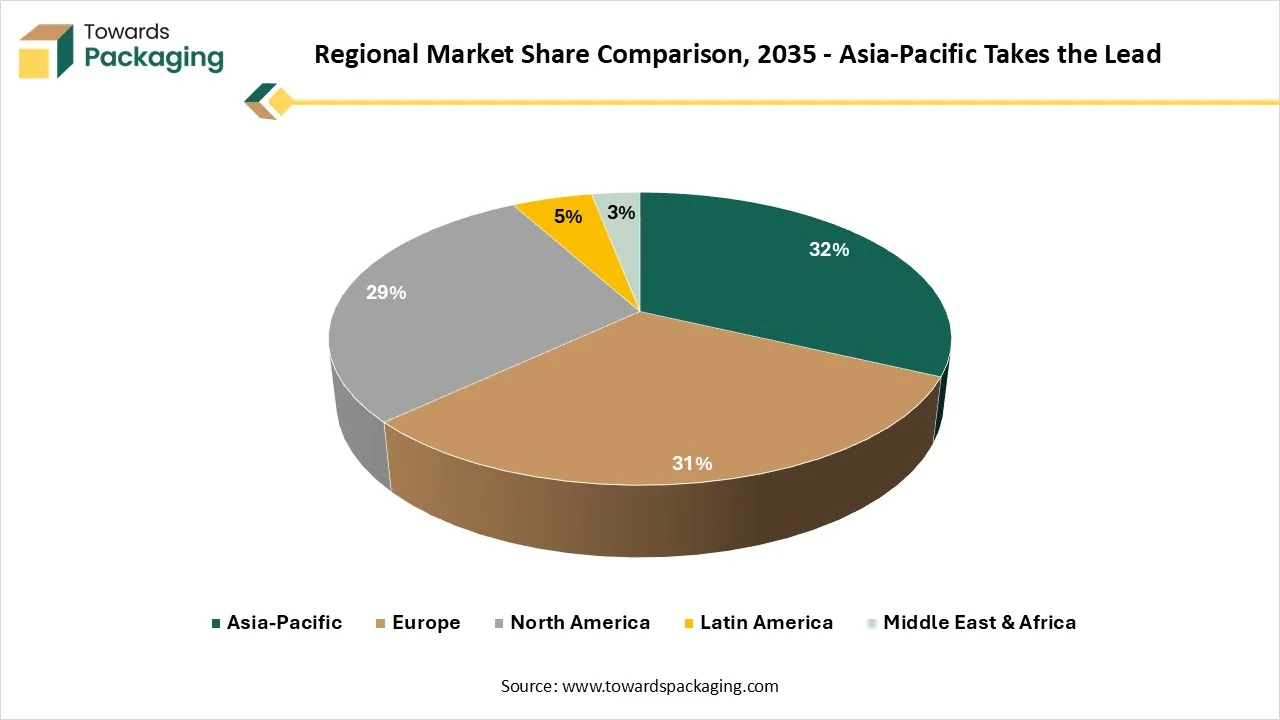
Asia Pacific is expected to dominate with a 32% share in the market by 2035 due to the massive activities in online retail and the growing food logistics. North America is expected to hold a 29% share by 2035 due to high-tech warehousing and massive last-mile activities. Europe is expected to hold a 31% share in the market by 2035 due to the presence of pooling giants and an eco-conscious industry. Latin America is expected to hold a 5% share by 2035 due to a lack of reverse logistics and dependence on informal sorting. MEA is expected to hold a 3% share in the market by 2035 due to a lag in stricter mandates and the high utilization of single-use flexible solutions.
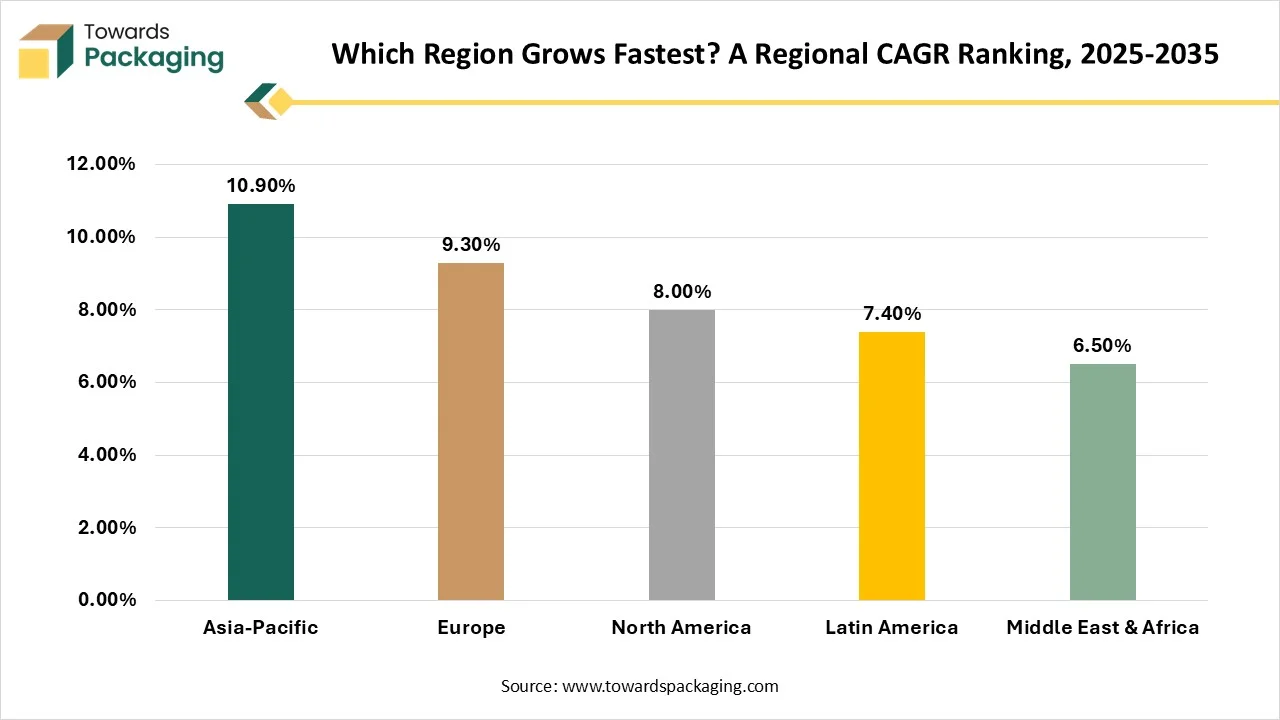
Asia Pacific is expected to grow with the fastest CAGR of 13.2% during the forecast period due to expanding electronics output and transition to multi-rotation containers. Europe is expected to grow with a 10.9% CAGR during the forecast period due to advancements like IoT asset tagging and growth in reusable crates. North America is expected to grow with a 10.5% CAGR during the forecast period due to strong pallet pooling systems and expansion of IoT-enabled monitoring. Latin America is expected to grow with a 9.5% CAGR during the forecast period due to the high cost of reusable containers and preference for SME. Middle East & Africa is expected to grow with an 8.7% CAGR during the forecast period due to hurdles in logistics and high use of traditional materials.
Source:- Towards Packaging Database
According to my research, the reusable shipping packaging market is gaining traction. The market is expanding globally due to smart tracking, regulatory push, and multi-trip cost optimizations. Regions like Europe, North America, and Asia Pacific are major contributors to the growth. Plastic-based reusable shipping packaging is leading. The leading companies are IFCO Systems, IPL Scholler, Smurfit WestRock, ORBIS Corporation, and Schoeller Allibert. Startups like Reusables, Returnity, and Repack support the expansion.
By Packaging Type
By Material
By Product Design
By Reuse Cycle
By Return Model
By Tracking Technology
By Application
By End User
By Shipping Distance
By Region
Towards Packaging Database
Independently Researched Sources


























Principal Research Analyst
Vidyesh Swar is a Senior Research Analyst at Towards Packaging, bringing over 4 years of dedicated expertise in market intelligence and strategic analysis across the dynamic world of packaging technologies and solutions.
Learn more about Vidyesh Swar

Reviewed By
Aditi Shivarkar, with 14+ years in packaging market research, specializes in food, beverage, and eco-friendly packaging. She ensures accurate, actionable insights, driving Towards Packaging Analytics & Consulting 's excellence in industry trends and sustainability.
Learn more about Aditi Shivarkar

Reusable Shipping Packaging Market
 Table of Content

 Download Sample
 Schedule a Meeting