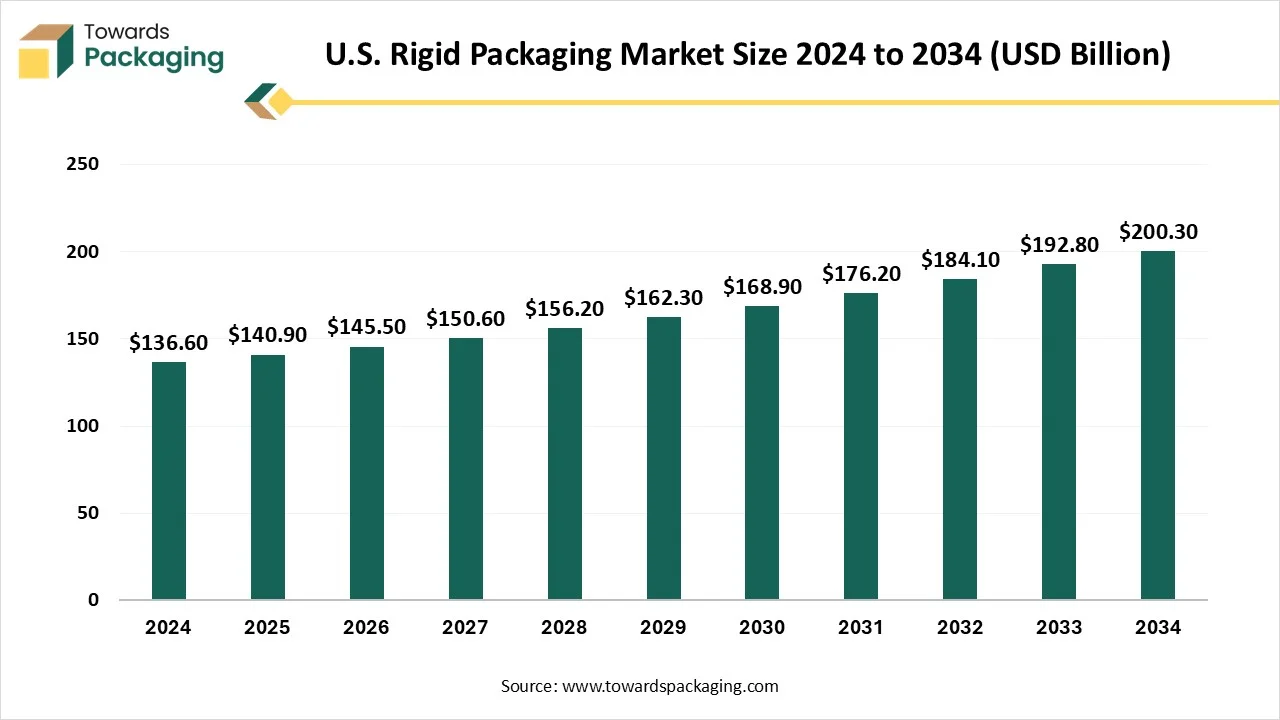
The U.S. rigid packaging market is forecasted to expand from USD 147.46 billion in 2026 to USD 208.08 billion by 2035, growing at a CAGR of 3.9% from 2026 to 2035. The report covers detailed regional insights across North America, Europe, Asia-Pacific, Latin America, and the Middle East & Africa, supported by competitive analysis of major players such as Amcor, Berry Global, Crown Holdings, Ball Corporation, and Sonoco. It also includes value chain analysis, trade flow data, manufacturing ecosystem insights, supplier mapping, innovation updates, and regulatory influences shaping the U.S. rigid packaging landscape.

The U.S. rigid packaging market encompasses the segment of the packaging industry in the United States that involves the use of rigid materials such as plastics, metals, and glass to create containers and packaging solutions. These packaging solutions are characterized by their solid, inflexible structures, providing durability and protection for a wide range of products, including food and beverages, pharmaceuticals, personal care items, and industrial goods. The market is driven by factors such as consumer demand for convenience, advancements in packaging technologies, and the need for sustainable and eco-friendly packaging solutions.
Sustainability in the U.S. rigid packaging market is increasingly shaped by regulations demanding higher recycled content, reduced waste generation, and lower emissions. In response, businesses are adopting reusable systems, lightening rigid formats, and using food-grade post-consumer recycled materials. Extended producer responsibility regulations at the state level are pressuring companies to fund recycling, enhance waste collection, and implement more transparent labeling procedures.
Investments in cutting-edge purification technologies are also being influenced by FDA safety regulations for recycled plastics to guarantee compliance for food and beverage applications. All things considered, regulatory pressure is hastening the transition from linear packaging systems to circular, traceable, and low-carbon alternatives.
The addition of AI technology in the U.S. rigid packaging market plays a crucial role from designing of the packaging to its distribution process. It is widely used to fulfil the sustainability goal of the major market players. Incorporation of AI in the production process enhance efficiency, reduce time, and lessen charges associated with these packages. It improves the quality of the packages to fulfil the demand of the consumers. Advanced technology help in choosing smart packaging materials such as compostable or bio-based plastics.
This longstanding federal law sets the foundation for waste management and recycling regulation in the United States. It establishes national goals to reduce waste generation, encourage recycling and source reduction, and ensure hazardous and nonhazardous waste (including packaging waste) are managed in an environmentally sound manner. The FPLA regulates how many consumer products must be packaged and labeled when sold across state lines. For rigid packaging used in consumer goods, the law requires clear labeling of contents, manufacturer/packer/distributor identity, net quantity (in both U.S. customary and metric units), and other disclosures.
In recent years, a growing number of U.S. states have passed legislation under the EPR framework. These laws shift responsibility for post-consumer packaging waste including rigid packaging, onto producers rather than municipalities.
")
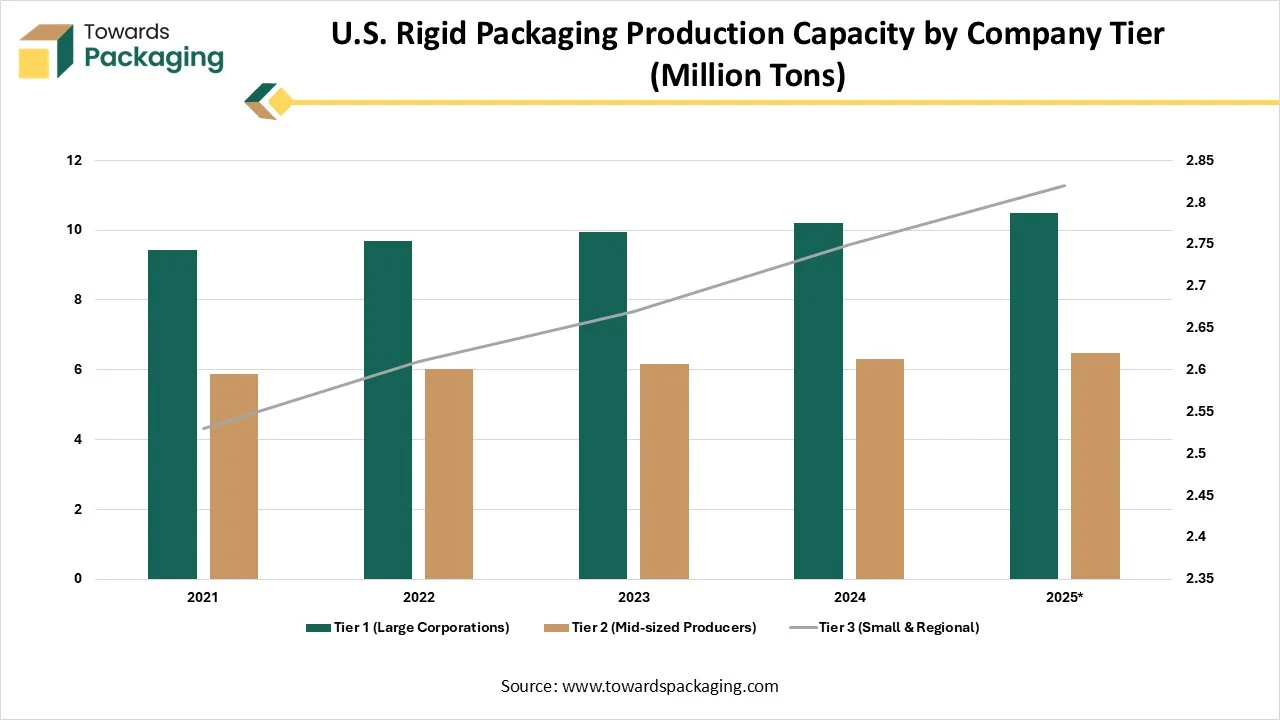
| Company Tier | 2021 | 2022 | 2023 | 2024 | 2025 |
| Tier 1 (Large Corporations) | 9.44 | 9.7 | 9.96 | 10.22 | 10.49 |
| Tier 2 (Mid-sized Producers) | 5.87 | 6.01 | 6.16 | 6.32 | 6.48 |
| Tier 3 (Small & Regional) | 2.53 | 2.61 | 2.67 | 2.75 | 2.82 |
Changing Consumers Lifestyle & Convenience Drive the U.S. Rigid Packaging Market
The changing consumers lifestyle and demand for convenience has driven the U.S. rigid packaging market. The major market players of this packaging concentrate on paper-based alternates due to increasing plastic waste and also its adverse effect on environment. The growing trend for sustainable packaging draw attention towards paper packaging and it is thriving as a noteworthy trend in the worldwide industry. Government authorities and organizations in the U.S. have increased their attention towards development of sustainable ecology. With its high strength and firmness, plastic is an ideal material for manufacturing rigid packaging for several products.
Ecological Pressures for Reduction of Plastic Waste Hindered the U.S. Rigid Packaging Market
The increasing ecological pressure associated with plastic packaging has hindered the expansion of the U.S. rigid packaging market. Instability in raw resource charges needed in production of the packaged goods is the main aspect hindering the development of the worldwide market. High charges connected with emerging the packing goods are also appraised to restrict market extension.
Rising Product Safety Extended the Opportunities of the U.S. Rigid Packaging Market
The increasing product safety extended has raised the opportunities for development of the U.S. rigid packaging market. The increasing adoption for recyclable, durable, and reusable packaging of products has boosted the innovation for rigid packaging in the U.S. The packaging protects from contamination, prevent the goods, simplifies storing & delivery, and comforts the procedure of managing packed goods in huge quantity. It offers an inaccessible inert ecology for the goods throughout transportation and storing, further permitting safe products delivery over long distances.
")
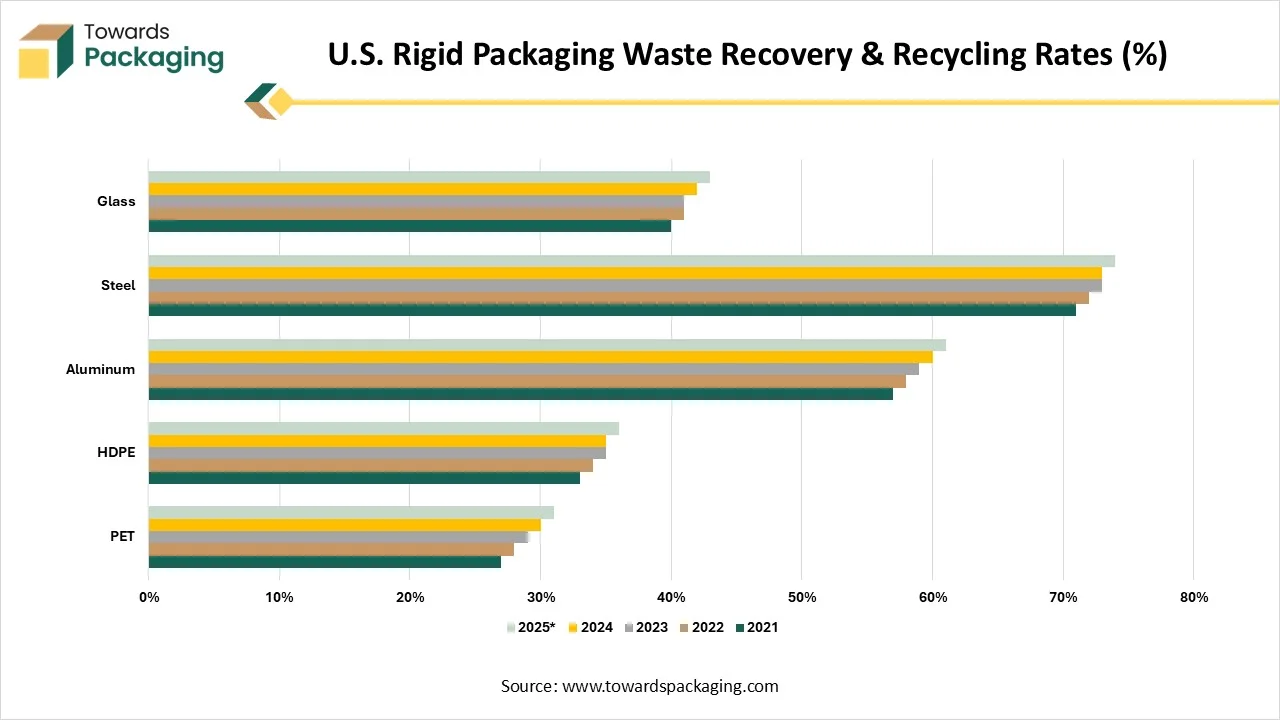
| Material | 2021 | 2022 | 2023 | 2024 | 2025 |
| PET | 27% | 28% | 29% | 30% | 31% |
| HDPE | 33% | 34% | 35% | 35% | 36% |
| Aluminum | 57% | 58% | 59% | 60% | 61% |
| Steel | 71% | 72% | 73% | 73% | 74% |
| Glass | 40% | 41% | 41% | 42% | 43% |
")
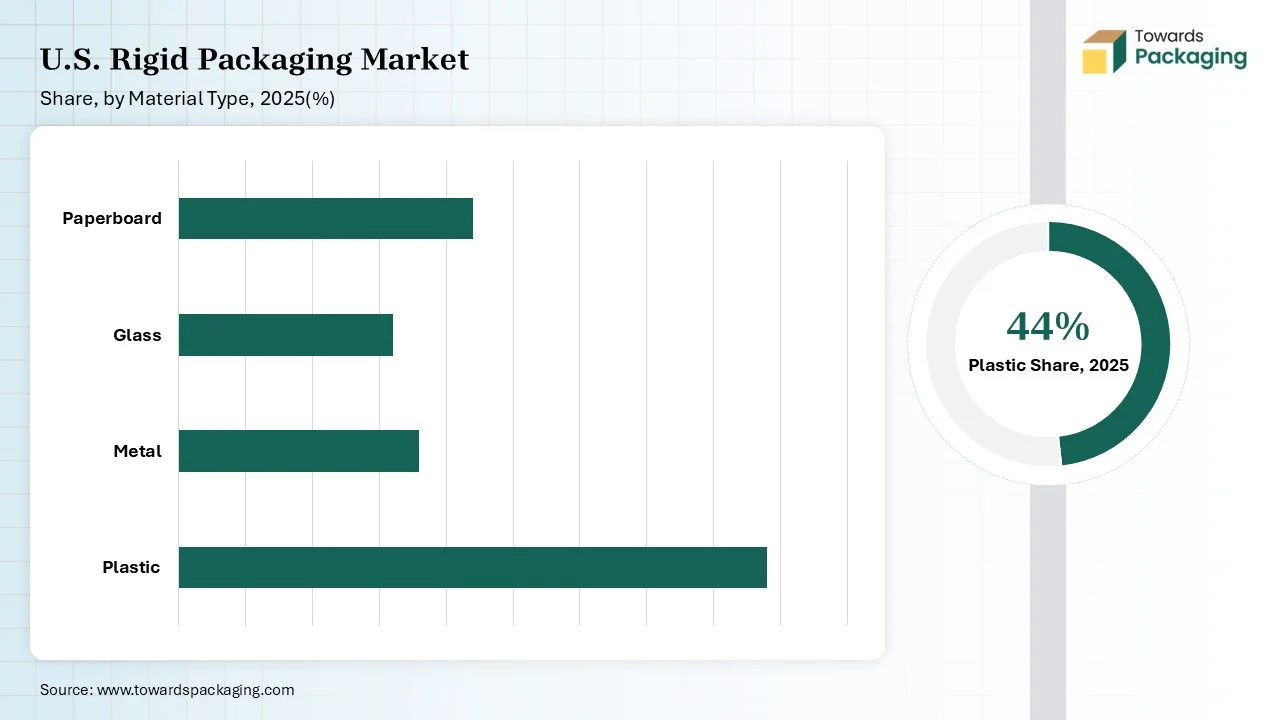
The plastic segment dominated the U.S. rigid packaging market in 2025 due to its high stability and strength. Plastic packaging resources are extensively utilized to grow inflexible packaging goods by producers worldwide. High easy molding, strength, and stability into several forms & dimensions are the essential properties that resulted in the development of this section in the worldwide packaging industries. Rigid plastics are majorly chosen over several other resources due to its low weight, charge, and formability features.
The biodegradable packaging segment is expected to grow at the fastest rate in the market during the forecast period of 2025 to 2034. This segment is growing due to strict government guidelines and rising consumer awareness. The rising sustainability goal of the market players has influenced the demand for this segment. The increasing awareness about the adverse effect of plastics on the ecology has also enhanced the shifting towards this sector.
The bottles and jars segment dominated the U.S. rigid packaging market in 2025 due to increasing demand for versatility, durability, and protective qualities. Bottles & jars are utilized on a huge scale in various end-use trades like food & beverages, personal, and household care due to their adaptable and biodegradable properties. These preserve and maintain the cleanliness of the goods for a prolonged period. Moreover, the exterior structures do not mark the goods, therefore resulting in huge demand.
The tubs and buckets segment is expected to grow at the fastest rate in the market during the forecast period of 2025 to 2034. This segment is growing due to changing lifestyle of people and growing e-commerce sector. The rising demand for ready-to-eat food has enhanced the usage of tubs and buckets in food & beverage industry. The growing expansion of e-commerce sector also enhances the demand for this segment for safe transportation of food products.
")
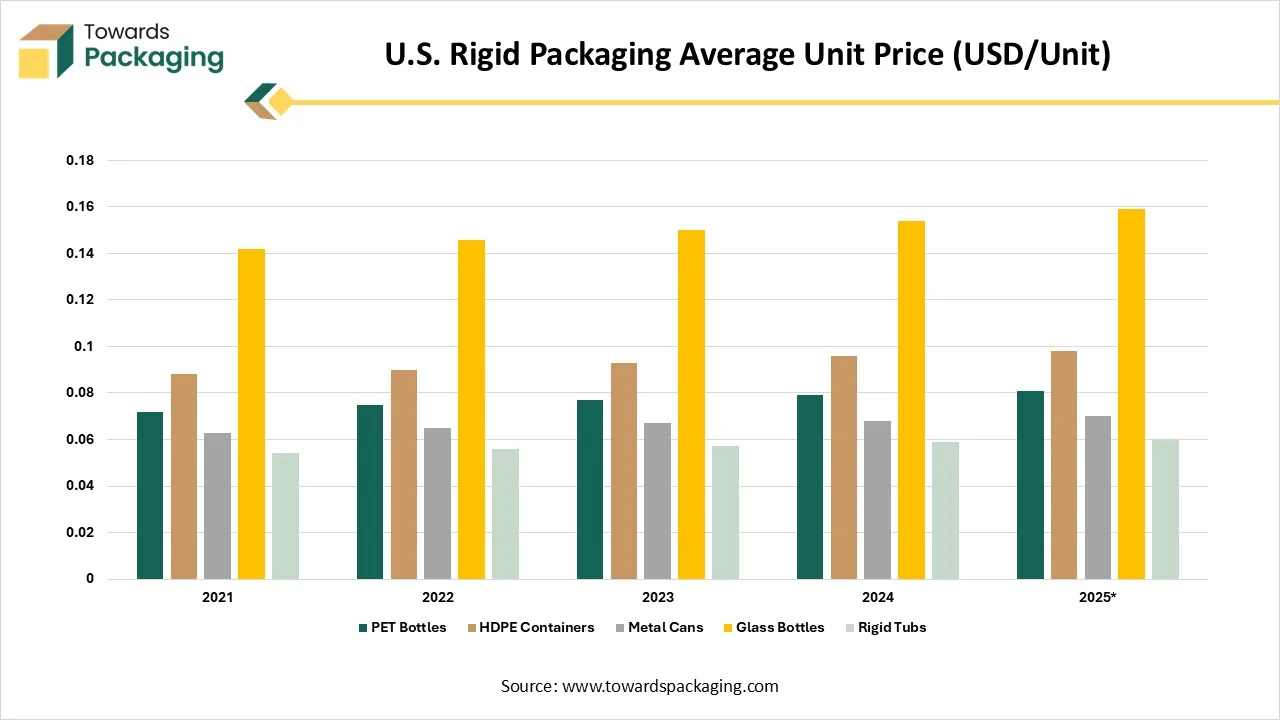
| Format | 2021 | 2022 | 2023 | 2024 | 2025 |
| PET Bottles | 0.072 | 0.075 | 0.077 | 0.079 | 0.081 |
| HDPE Containers | 0.088 | 0.09 | 0.093 | 0.096 | 0.098 |
| Metal Cans | 0.063 | 0.065 | 0.067 | 0.068 | 0.07 |
| Glass Bottles | 0.142 | 0.146 | 0.15 | 0.154 | 0.159 |
| Rigid Tubs | 0.054 | 0.056 | 0.057 | 0.059 | 0.06 |
")
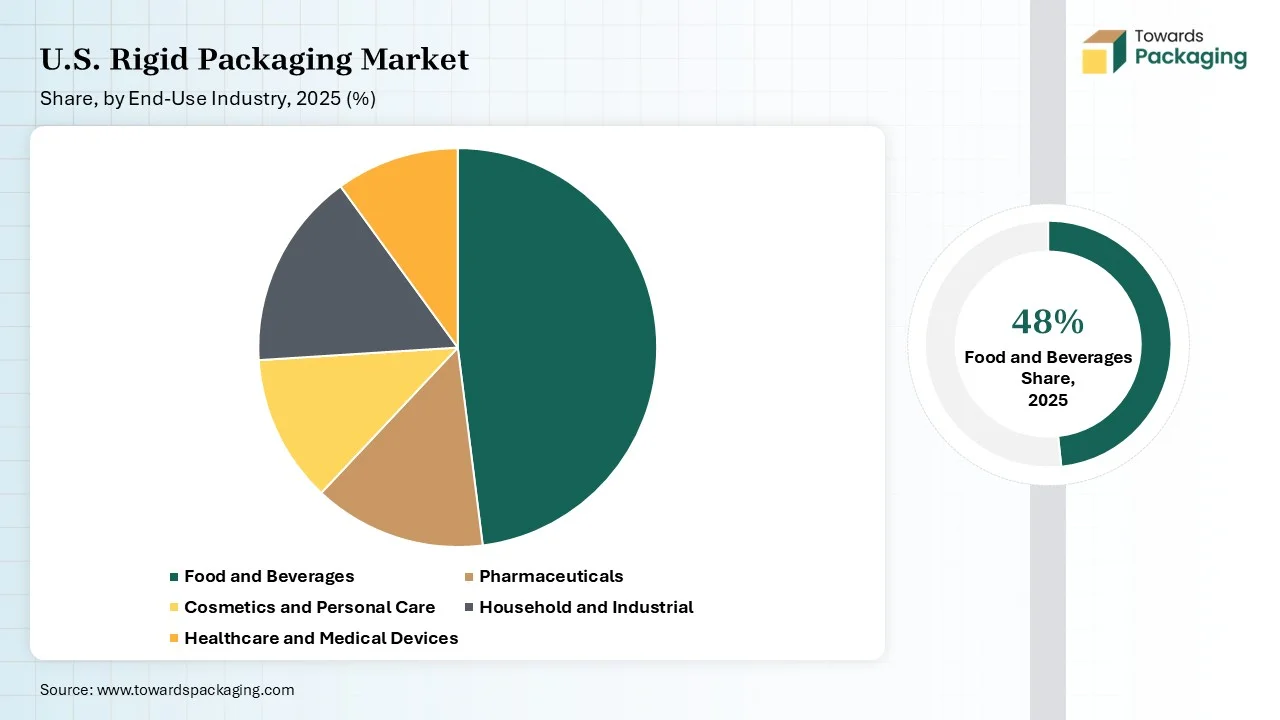
The food & beverages segment held the largest share of the U.S. rigid packaging market in 2025 due to busy lifestyle of working individuals. The expanding demand for packed and administered food items due to the changes in the lifestyle habits is the major factor influencing the development of the food & beverage in the end-use industry section. Furthermore, the growing demand for ready-to-eat food items aids the development of the segment. Growing retail food vents and expansion in food items are expected to enhance the growth of the segment.
The pharmaceuticals segment is expected to grow at the fastest rate in the market during the forecast period of 2025 to 2034. This segment is growing due to rising concern towards safety of the packaged products. It is highly controlled to safeguard the safety and effectiveness of the drugs. This requires packaging keys that fulfil strict standards for traceability, protection, and tamper evidence. Rigid packaging in this industry like blister packs, bottles, and vials, offers the essential security and durability to obey with these guidelines.
The blow molding segment held the largest share of the U.S. rigid packaging market in 2025 due to increasing demand for sustainable packaging in various industries. The significant expansion in the construction and automotive industries has raised the demand for this sector. These are lightweight components which are fuelled the development of the construction industry. This production process is majorly used in the consumer goods, food & beverages, and industrial packaging sector where there is a huge demand for hollow containers and bottles.
The thermoforming segment is expected to grow at the fastest rate in the market during the forecast period of 2025 to 2034. This segment is growing due to its high recyclability capacity. This process helps in producing enhanced shelf-life and highly recyclable packaging which boost its huge adoption by the major market players. There is a wide scope of innovation available in the production technology which attract several brands towards this segment.
")
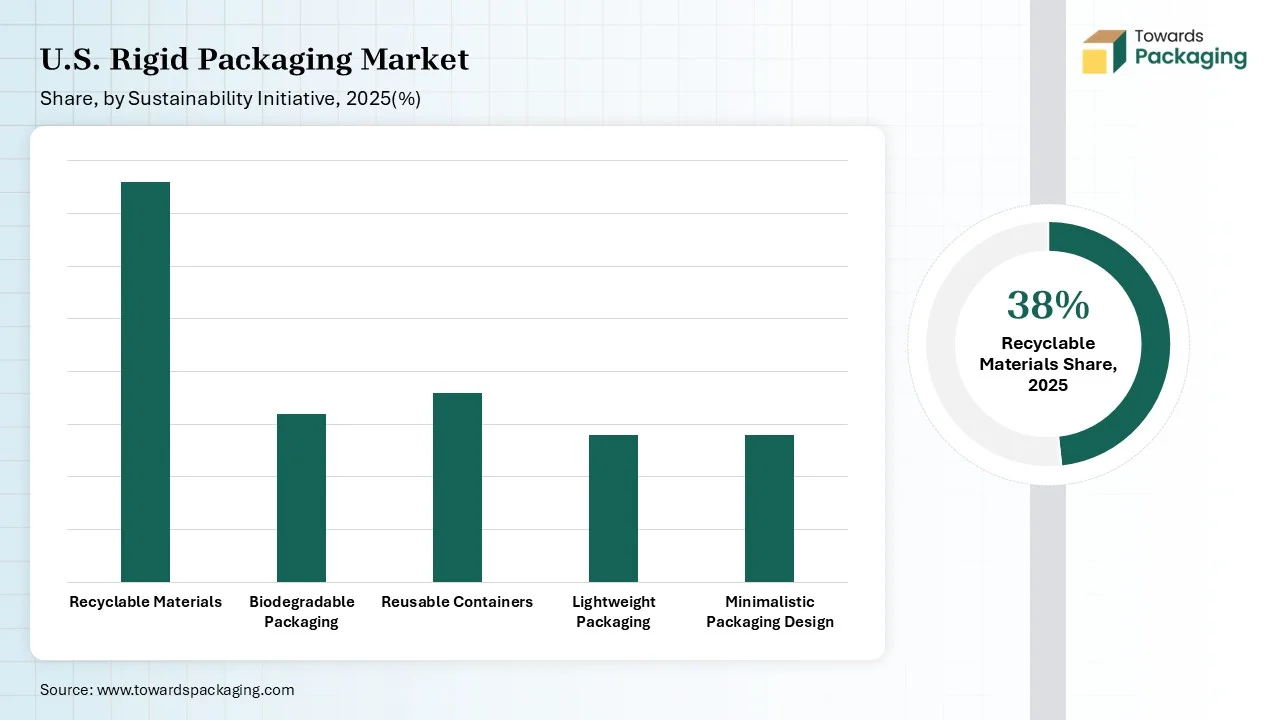
The recyclable materials segment held the largest share of the U.S. rigid packaging market in 2025 due to rising ecological concern. The major materials used in this segment are polyethylene (PE), polyethylene terephthalate (PET), glass, and paper. These are also used for their strength and clarity which attract huge consumers towards this segment. Increasing construction of recycling infrastructures has also influenced the use of this segment.
The biodegradable packaging segment is expected to grow at the fastest rate in the market during the forecast period of 2025 to 2034. This segment is growing due to presence of advance materials for packaging. The growing sustainability goals among major market players has raised the demand for this sector. The major factors behind the growth of this sector are ecological concern and rising sustainability goals worldwide.
")
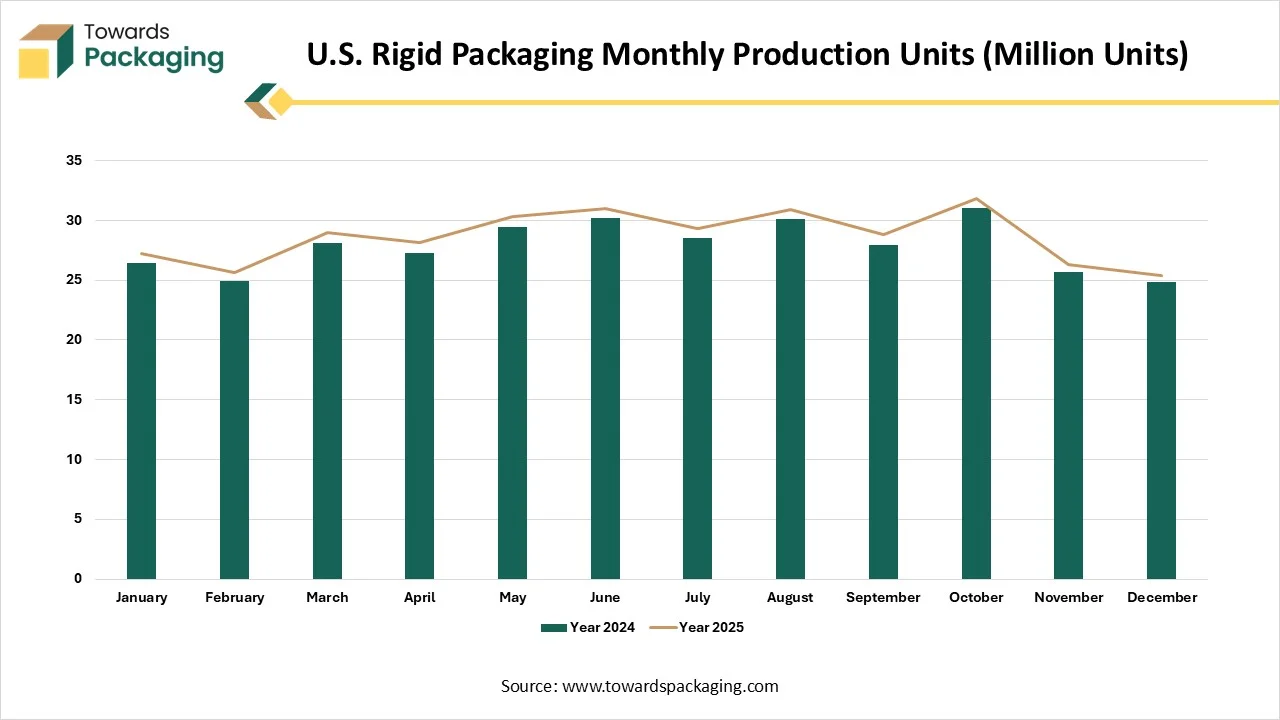
| Month | Year 2024 | Year 2025 |
| January | 26.4 | 27.2 |
| February | 24.9 | 25.6 |
| March | 28.1 | 29 |
| April | 27.3 | 28.1 |
| May | 29.4 | 30.3 |
| June | 30.2 | 31 |
| July | 28.5 | 29.3 |
| August | 30.1 | 30.9 |
| September | 27.9 | 28.8 |
| October | 31 | 31.8 |
| November | 25.7 | 26.3 |
| December | 24.8 | 25.4 |
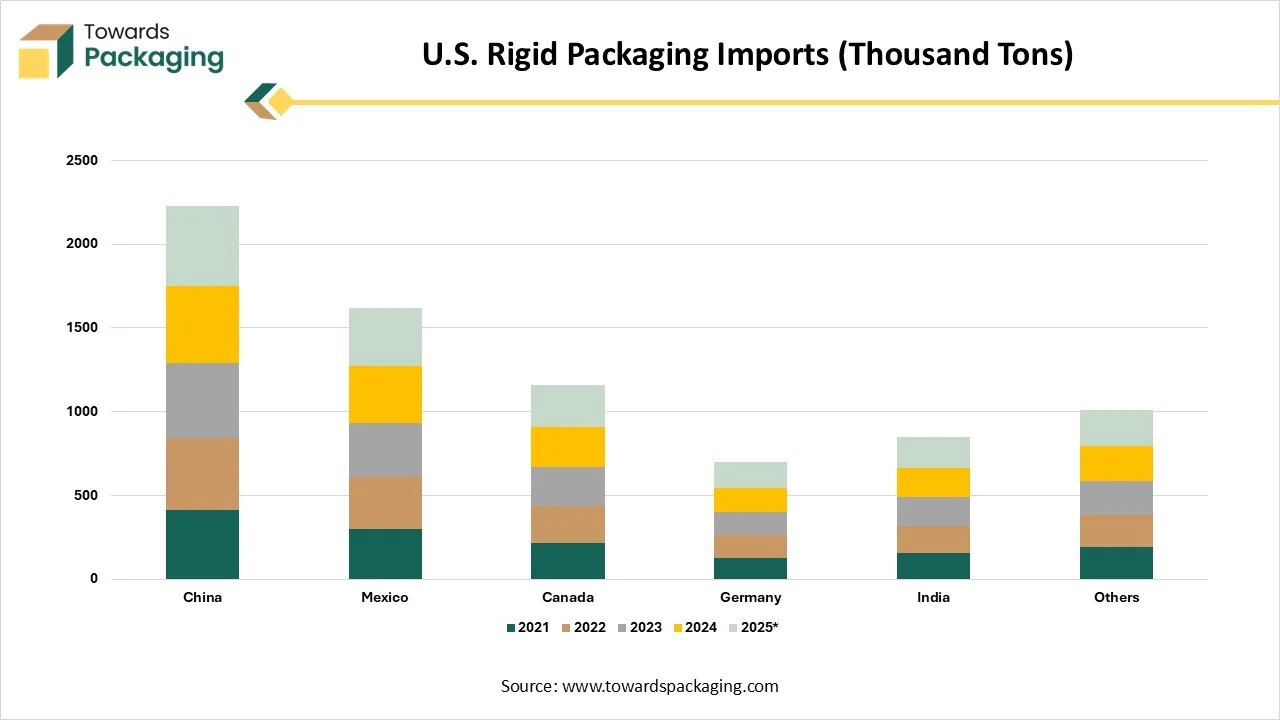
Considering North American market, U.S. held a substantial share in rigid packaging market, due to the presence of strict packaging guidelines. The rapid growth in online shopping has also raised the demand for such packaging in this country for safe delivery of products. Rigid packaging guards an extensive variety of goods, from cosmetics to electronics, confirming intact transportation. Moreover, customers and producers have progressively become more ecologically aware, influencing the requirement for eco-friendly and recyclable packaging resolutions. In accumulation, rigid packaging produced from materials comprising glass and a few types of plastics which has gained significant traction as it brings into line with worldwide sustainability goals.
")
| Country of Origin | 2021 | 2022 | 2023 | 2024 | 2025 |
| China | 412 | 431 | 446 | 462 | 478 |
| Mexico | 297 | 312 | 324 | 337 | 351 |
| Canada | 214 | 223 | 231 | 241 | 250 |
| Germany | 128 | 133 | 139 | 145 | 151 |
| India | 155 | 163 | 170 | 177 | 184 |
| Others | 189 | 196 | 202 | 208 | 215 |
")
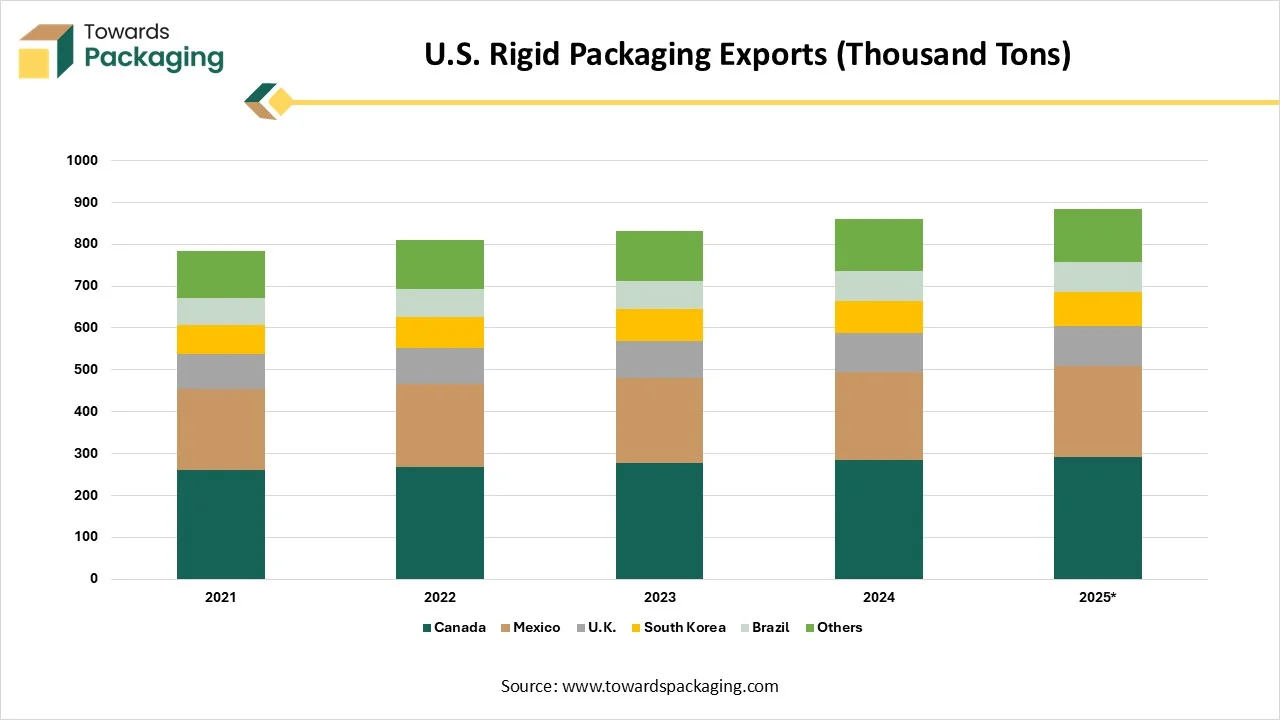
| Destination | 2021 | 2022 | 2023 | 2024 | 2025 |
| Canada | 261 | 268 | 276 | 284 | 292 |
| Mexico | 192 | 199 | 204 | 211 | 218 |
| U.K. | 84 | 86 | 89 | 92 | 95 |
| South Korea | 71 | 74 | 76 | 78 | 80 |
| Brazil | 63 | 66 | 68 | 71 | 73 |
| Others | 112 | 116 | 119 | 123 | 126 |
The raw materials used in this market are majorly glass, metal, paperboard, polyethylene (PE), polypropylene (PP), polyethylene terephthalate (PET) and several others.
The components manufacturing sector includes preforms, bottles, containers, and closures.
It is important for safe product transportation to meet the demand of the consumers with standardized format.
| Metric | FY 2024 | FY 2025 | Change (Reported) |
|---|---|---|---|
| Net Sales | $3,353M | $5,745M | +71% |
| Net Income | $191M | $262M | — |
| Diluted EPS (US cents) | 13.2 | 11.3 | — |
| Metric | FY 2024 | FY 2025 | Change (Reported) | Change (Constant Currency) |
|---|---|---|---|---|
| Net Sales | $3,353M | $5,745M | +71% | +68% |
| EBITDA | $466M | $909M | +95% | +92% |
| EBIT | $365M | $687M | +88% | +85% |
| Net Income | $234M | $448M | +91% | +88% |
| Diluted EPS (US cents) | 16.2 | 19.3 | +20% | +18% |
| Free Cash Flow | -$395M | -$343M | — | — |
| Metric | FY 2024 | FY 2025 | Reported Change | Constant Currency Change |
|---|---|---|---|---|
| Net Sales | $2,552M | $3,257M | +28% | +25% |
| Adjusted EBIT | $329M | $426M | +29% | +28% |
| EBIT Margin | 12.9% | 13.1% | — | — |
| Metric | FY 2024 | FY 2025 | Reported Change | Constant Currency Change |
|---|---|---|---|---|
| Net Sales | $801M | $2,488M | +211% | +205% |
| Adjusted EBIT | $62M | $295M | +377% | +365% |
| EBIT Margin | 7.7% | 11.9% | — | — |
| Category | Amount |
|---|---|
| Total Q1 Synergies | ~$38M |
| Impact to EBIT | ~$33M |
| Impact to Interest Expense | ~$5M |
| Expected Total FY26 Synergies | ≥ $260M |
| Total Identified Synergies by FY28 | $650M |
| Detail | Value |
|---|---|
| New Quarterly Dividend | 13.0 cents per share |
| Prior Year Q1 Dividend | 12.75 cents |
| ASX Holder Payment | 19.78 AUD cents |
| Ex-Dividend Dates | Nov 27 (ASX), Nov 28 (NYSE) |
| Record Date | Nov 28, 2025 |
| Payment Date | Dec 17, 2025 |
| Metric | FY26 Guidance |
|---|---|
| Adjusted EPS | 80–83 cents (12–17% growth) |
| Free Cash Flow | $1.8–$1.9B |
| Capex | $850–$900M |
| Net Interest Expense | $570–$600M |
| Effective Tax Rate | 19–21% |
| Expected FY26 Synergies | ≥ $260M |

By Material Type
By Product Type
By End-Use Industry
By Production Process
By Sustainability Initiatives

Research & Advisory Analyst
Yogesh Kulkarni is an experienced Research Analyst specializing in the packaging sector, with a strong foundation in statistical analysis and market intelligence. He currently contributes his expertise to Towards Packaging.
Learn more about Yogesh Kulkarni
Reviewed By
Aditi Shivarkar, with 14+ years in packaging market research, specializes in food, beverage, and eco-friendly packaging. She ensures accurate, actionable insights, driving Towards Packaging Analytics & Consulting 's excellence in industry trends and sustainability.
Learn more about Aditi ShivarkarU.S. Rigid Packaging Market