


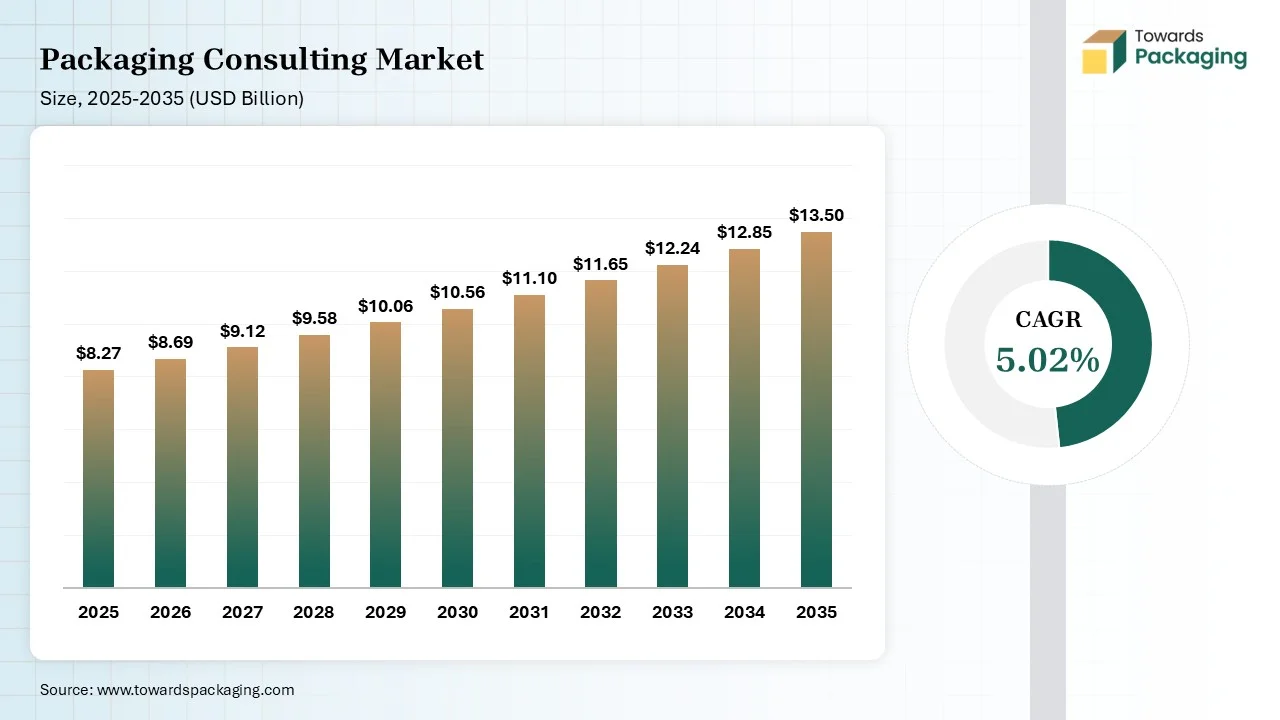
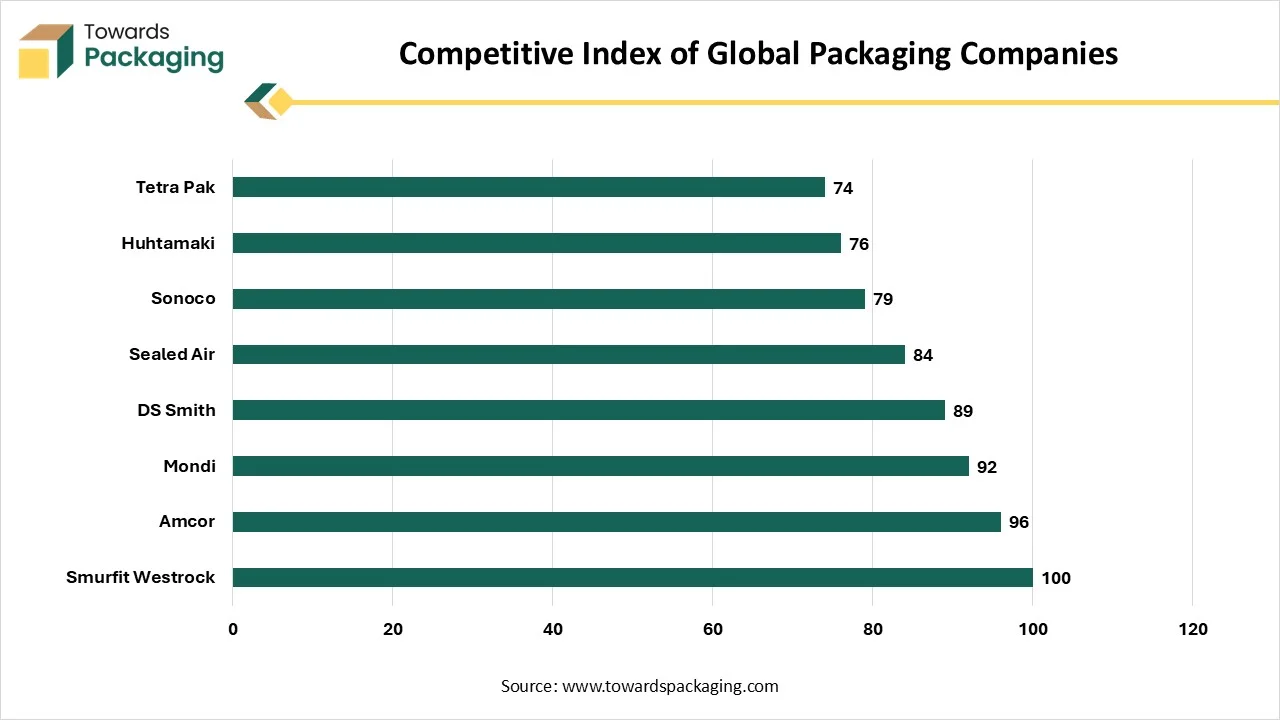
According to Vidyesh Swar, who has high experienced in packaging materials, bio-based packaging, and smart packaging. The global packaging consulting market size was estimated at $8.27B in 2025. The market is predicted to grow at a CAGR of 5.02% during 2026-2035. Factors like sustainability needs, a boom in smart shipping boxes, development of new packaging technology, and supply chain optimization drive the growth. Large enterprises held a 68.35% share in the market in 2025. Packaging manufacturers like DS Smith, Sealed Air, Tetra Pak, and Amcor are leaders in the market.
Packaging consulting is a specialized service in which expert helps in designing best packaging solutions for businesses. They offer services like packaging engineering, regulatory testing, material optimization, supply chain, sustainability, cost optimization, and automation. Packaging consulting offers stronger branding, better product protection, and sustainability upgrades. The key responsibilities of packaging consulting are cost reduction, performance testing, and supplier sourcing. The top packaging consulting firms are McKinsey & Company, Berlin Packaging, Aura, Smithers, and Intertek Group plc. Packaging consulting focuses on providing operational, sustainability, technical, and financial objectives.
| Market Metric | Value |
| Market Value, 2025 | USD 8.27 Billion |
| Forecast CAGR, 2026-2035 | 5.02% |
| Largest Regional Share, 2025 | 34.25% |
| Largest Client Group Share, 2025 | 29.60% |
| Largest End-Use Share, 2025 | 27.45% |
| Largest Organization Size Share, 2025 | 68.35% |
The global packaging consulting market value was estimated at $8.27B in 2025 and is expected to grow at a CAGR of 5.02% between 2026 and 2035. The growth of the market is driven by factors like the transition to sustainable solutions, online retail, smart packaging adoption, food safety demand, rise in AI-based design, increased standards for medical packaging, businesses' focus on packaging optimization, and improvement in environmental compliance. Packaging redesign, value engineering, and sustainability strategy supports in the market growth. Top firms like McKinsey & Company, Intertek Group, Boston Consulting Group, and Deloitte support the growth.
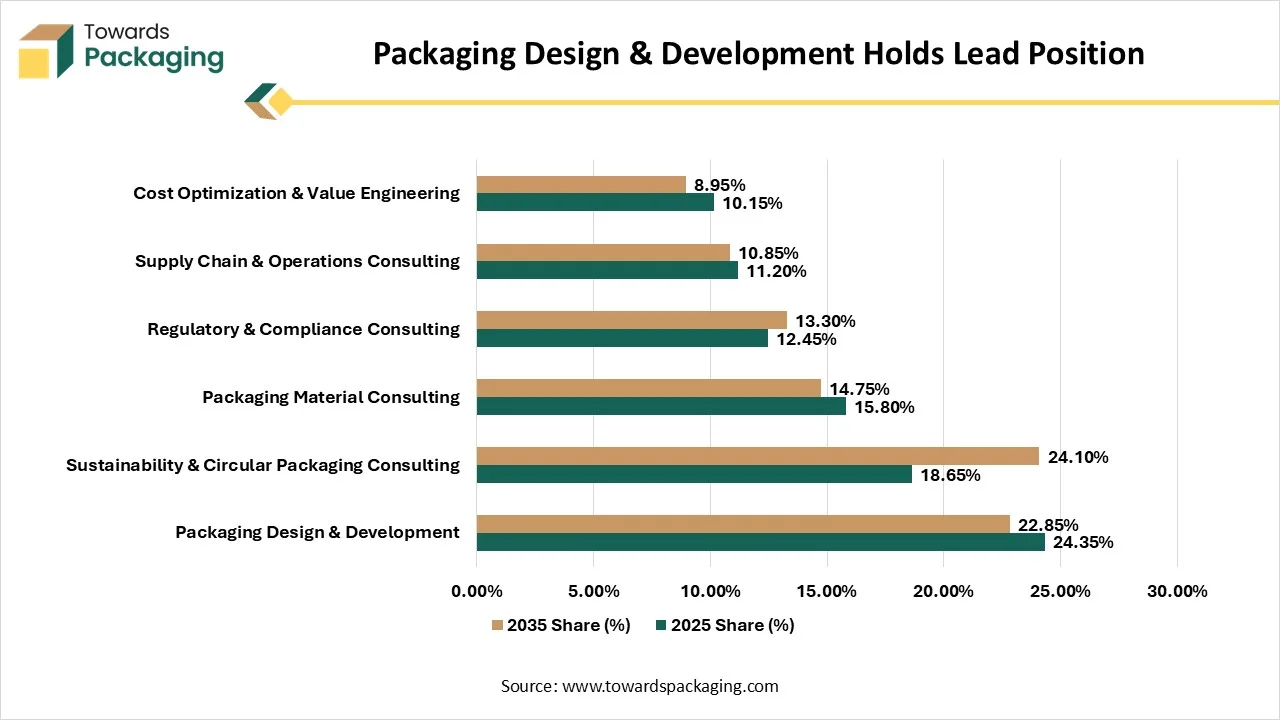
Packaging design & development dominated the packaging consulting industry with a 24.35% share in 2025. The focus on influencing purchase decisions and complex eco-regulations increases demand for packaging design & development. The need for palletization density of packaging and a focus on providing engaging unboxing experiences increases the use of packaging design & development. Sustainability & circular packaging consulting is expected to grow at a CAGR of 7.95% during the forecast period. The stringent labeling standards and the rise in eco-friendly brands increase demand for sustainability & circular packaging consulting. The complex sustainable designs, risk mitigation, and complex material innovation support the growth.
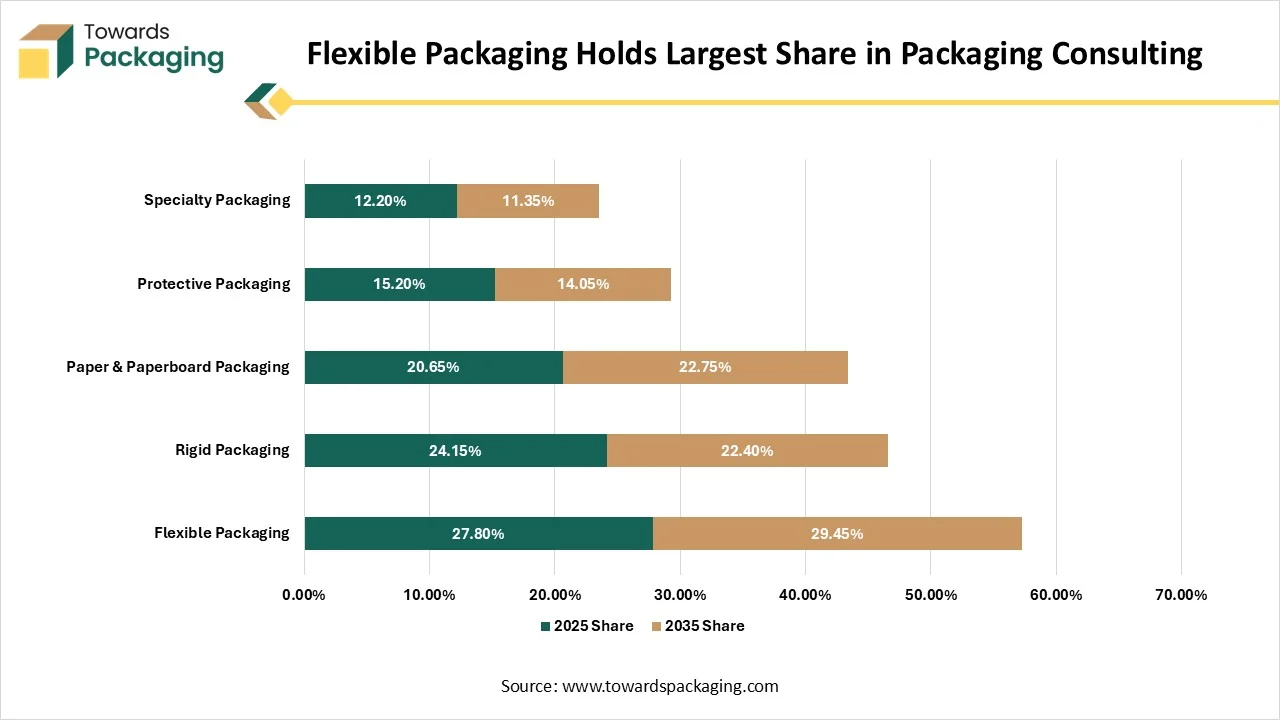
Flexible packaging dominated the packaging consulting industry with a 27.80% share in 2025. The interest in space-saving packaging and increased shopping for portable items increase the use of flexible packaging. Surging biodegradable films and the rise in online retail delivery increase the use of flexible packaging. Paper & paperboard packaging is expected to grow at a CAGR of 6.10% in the market during the forecast period. The increased redesigning of packaging and the surging demand for recyclable corrugated boxes increase the use of paper & paperboard packaging. Expanding specialized fiber grades and compliant material transition supports the overall growth.
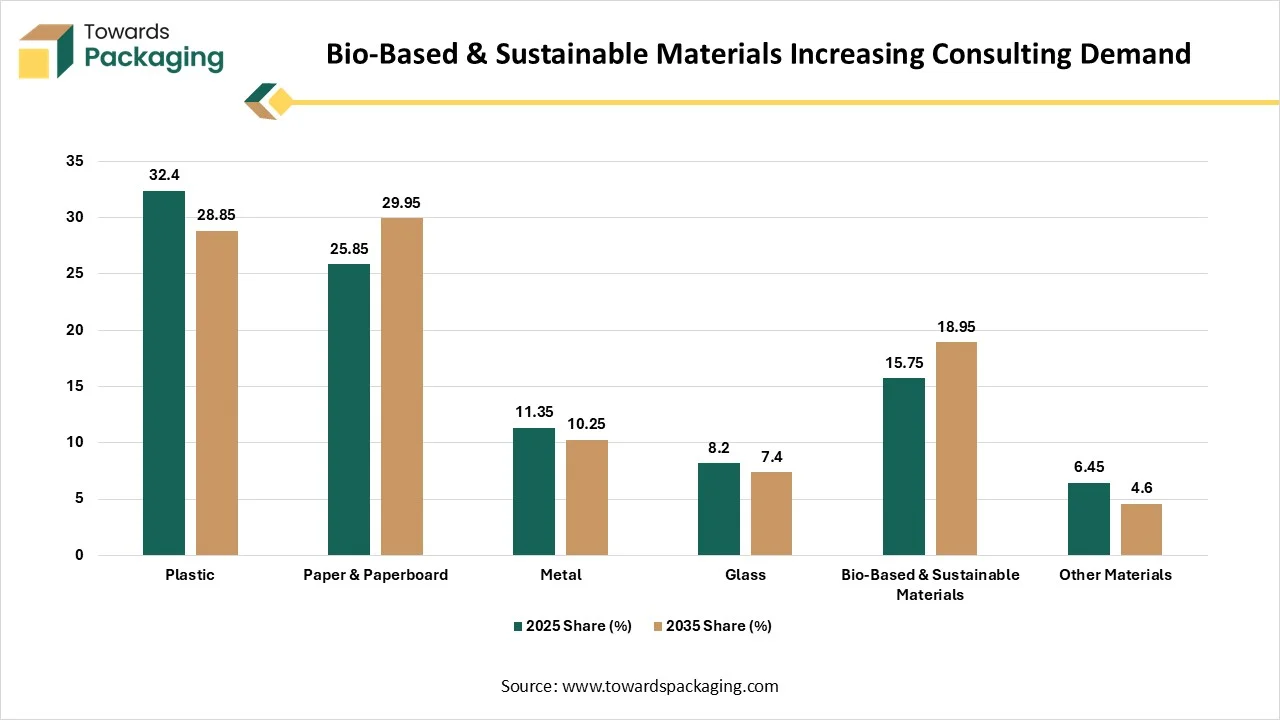
Plastic dominated the packaging consulting industry with a 32.40% share in 2025. The surge in rigid plastic packaging and safety requirements in diverse industries increases the use of plastic. The increasing use of plastics in healthcare and the manufacturing of soft plastic films drives the overall growth. Bio-based & sustainable materials are expected to grow at a CAGR of 7.55% in the market during the forecast period. The redesigning of packaging according to sustainability and plastic bans increases the use of bio-based & sustainable materials. Brands focus on avoiding greenwashing claims, and manufacturing compostable packaging uses bio-based & sustainable materials, supporting the growth.
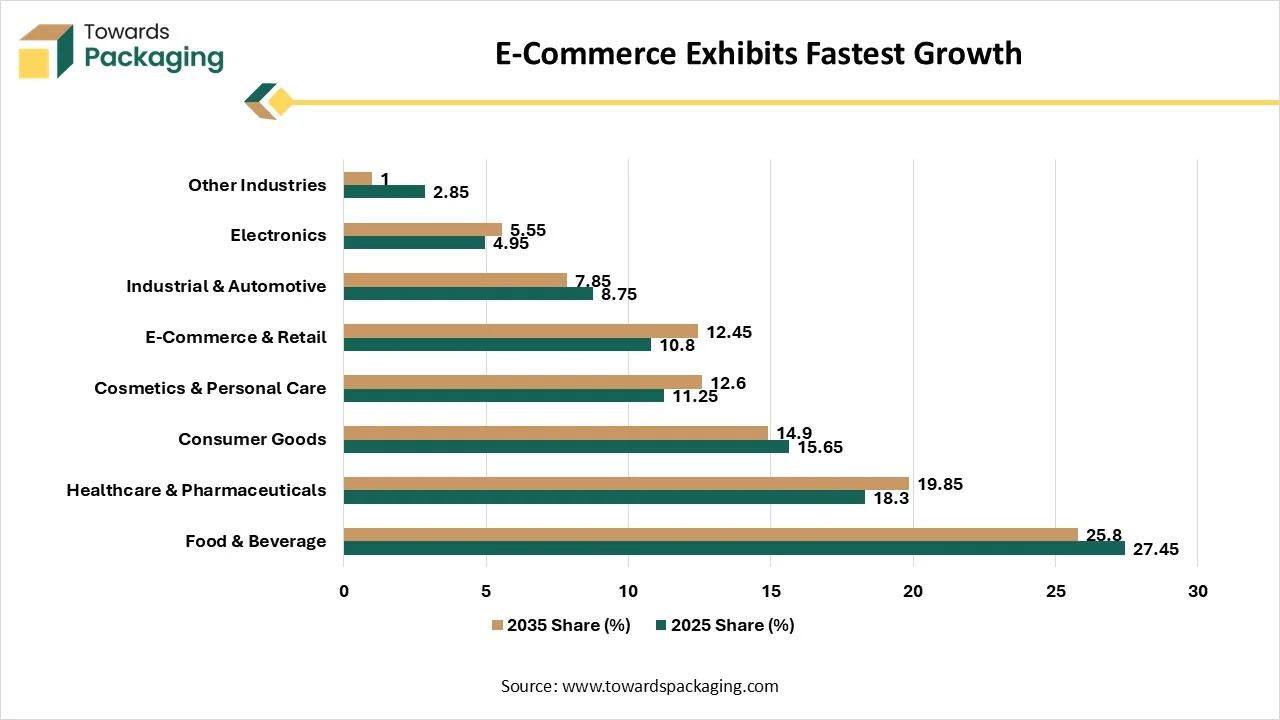
Food & beverage dominated the packaging consulting industry with a 27.45% share in 2025 due to the increased changes in food safety regulations. The rise in circular business models and the explosion of meal delivery platforms increase demand for packaging consulting. The high manufacturing of F&B items is driving the market growth. E-commerce & retail is expected to grow at a CAGR of 6.65% in the market during the forecast period. The handling of warehouse storage and online retail preference for premium packaging increases the use of packaging consulting. The increased launch of new e-commerce brands and rise in hyper-local businesses supports the market growth.
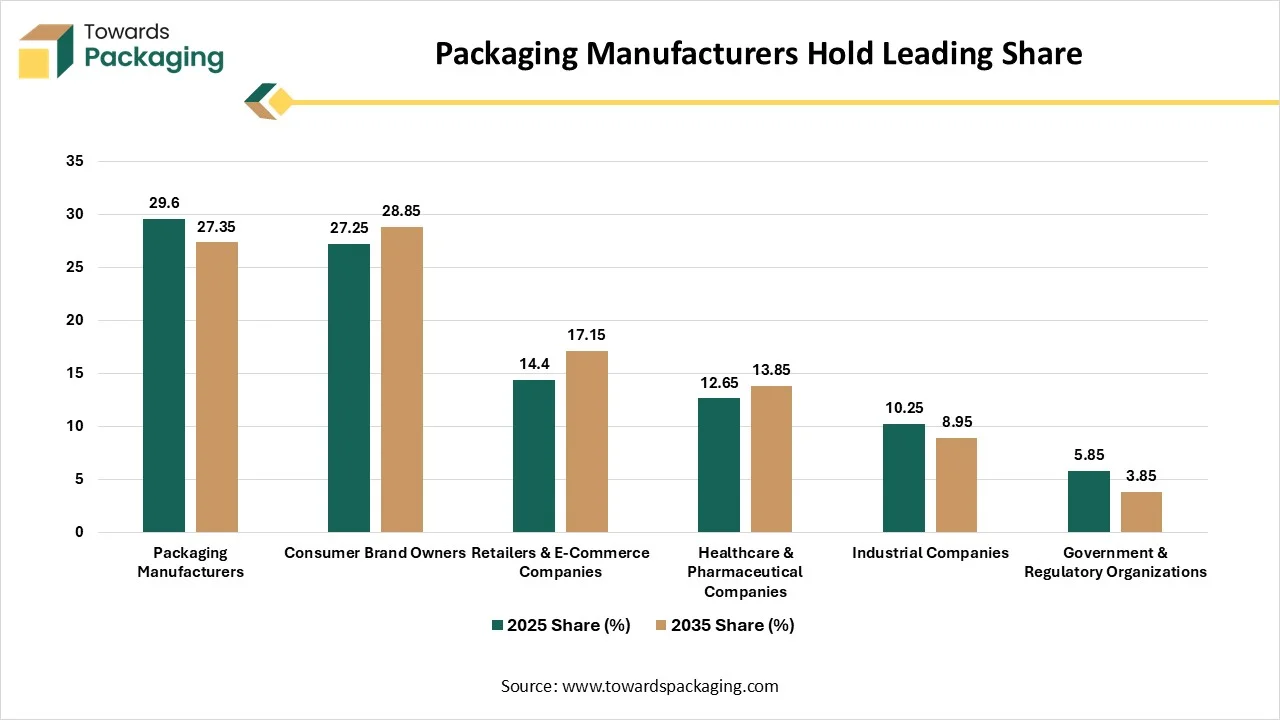
Packaging manufacturers dominated the packaging consulting industry with a 29.60% share in 2025. The demand for direct material expertise and seamless manufacturing transition increases the use of packaging consulting. Sustainability guidance, supply chain integration, and material optimization drive the growth. Retailers & e-commerce companies are expected to grow at a CAGR of 6.95% in the market during the forecast period. The multi-stop transit in e-commerce and D2C brands focuses on visual appeal, which helps with expansion. The preference for easy return logistics and the rise in right-sizing software boost the overall growth.
| Organization Size | 2025 Share (%) | 2035 Share (%) | CAGR |
| Large Enterprises | 68.35 | 64.20 | 4.35% |
| Small & Medium-Sized Enterprises | 31.65 | 35.80 | 6.55% |
Large Enterprises dominated the packaging consulting industry with a 68.35% share in 2025. The management of stock-keeping units and the need for multi-disciplinary compliance increase the use of packaging consulting. Companies' investment in the replacement of traditional plastic and large-scale procurement helps in market growth. Small & medium-sized enterprises are expected to grow at a CAGR of 6.55% in the market during the forecast period. SMEs focus on preventing expensive fines, and the rise in the search for affordable green materials increases the use of packaging consulting. SMEs focus on integrating smart packaging, and the absence of in-house expertise boosts overall growth.
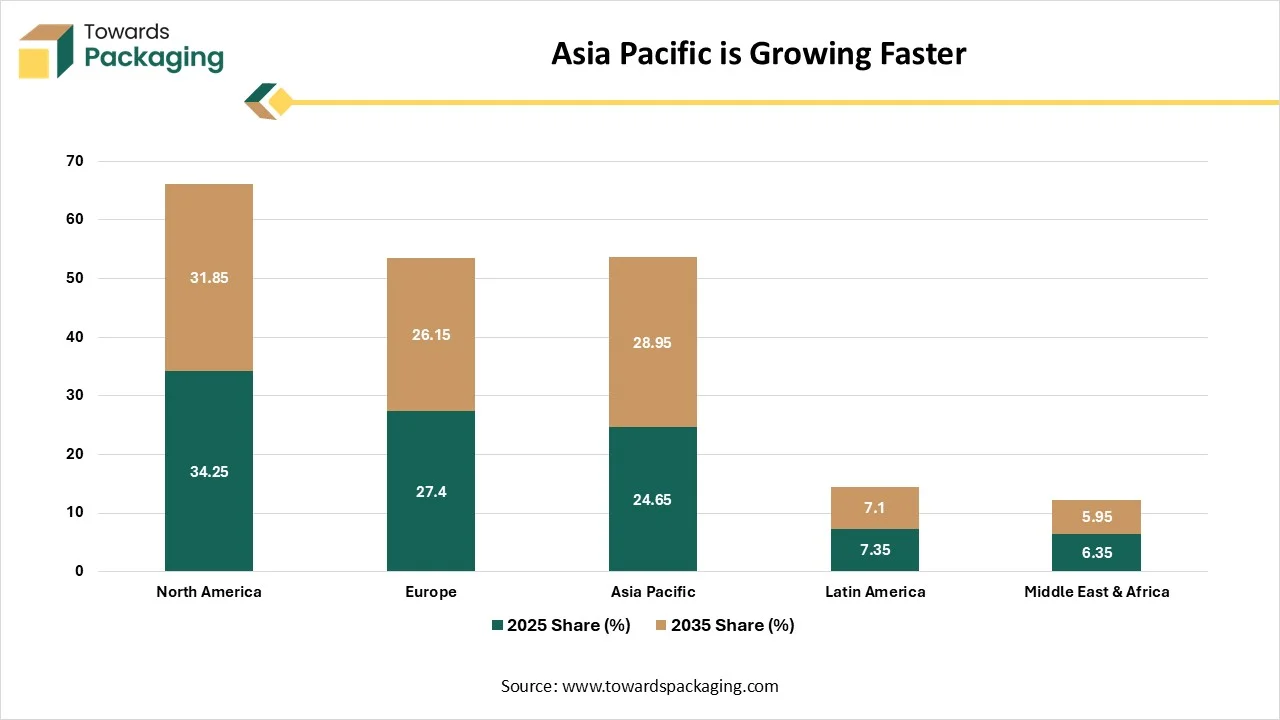
North America dominated the packaging consulting industry with a 34.25% share in 2025. FDA’s labeling standards and companies' eco-friendly transitions increase demand for packaging consulting. The penetration of online retail and mature logistics infrastructure increases adoption of packaging consulting. High digital commerce sales and the management of complex packaging manufacturing drive growth.
United States
The United States is the leading contributor in the North America region. The presence of an online retail fulfillment base and the need for high-level technical support increase the use of packaging consulting. The robotics integration in packaging and dependence on third-party packaging providers increase the use of packaging consulting. The widespread automation boosts the overall growth.
Europe held a 27.40% share in the market in 2025. The national government's stringent rules and focus on balancing circularity goals increase demand for expert advice. The rise in plastic replacement with paper and the implementation of advanced automation increase demand for packaging consulting. The rapidly growing online shopping boosts overall growth.
Germany
Germany is a robust contributor to the market. Initiatives like expanded deposit schemes in Germany and businesses' focus on reverse-logistics tracking increase the use of packaging consulting. Bioplastic innovation and increased green credential verification help with expansion. The demand for expert guidance for sustainable packaging development supports the overall growth.
Asia Pacific held a 24.65% share in the market in 2025 and is expected to grow at a CAGR of 6.85% during the forecast period. Digital penetration in China and increased consumer awareness increase the use of packaging consulting. The massive industrial production and need for specialized packaging strategies increase the use of packaging consulting, supporting the overall growth.
China
China is the leading player in the market. The availability of platforms like JD.com and the handling of large logistics increases the need for packaging consulting. The focus on meeting new recycling standards and high PP & PE production increases demand for packaging consulting. A surge in custom digital printing in industrial sectors boosts the overall growth.
Latin America held a 7.35% share in the market in 2025. The need for experts in developing biodegradable options and the massive use of flexible pouches increases the adoption of packaging consulting. The increasing local pressure for utilization of eco-friendly materials, stringent quality adherence, and increasing raw material costs increase demand for packaging consulting, boosting the overall growth.
Brazil
Brazil is the top contributor in the market in the Latin America region. The sustainability pressures on brands and the requirement for lightweight shipping solutions increase the adoption of packaging consulting. The export packaging complexity and regulations from IBAMA agencies help with expansion. The ongoing packaging innovations support growth.
The Middle East & Africa held a 6.35% share in the market in 2025. The expansion of mobile technologies and the need for better commercial packaging increase the use of packaging consulting. The plastic bans in countries like South Africa and investment in advanced technologies help with expansion. Companies focusing on NFC authentication boost overall growth.
Saudi Arabia
Saudi Arabia is a robust player in the market. The optimization of specialized packaging and the demand for technical consulting increase adoption of packaging consulting. The high need for compliance consulting and initiatives like Made in Saudi increase use of packaging consulting. The focus on packaging-line efficiencies supports the overall growth.
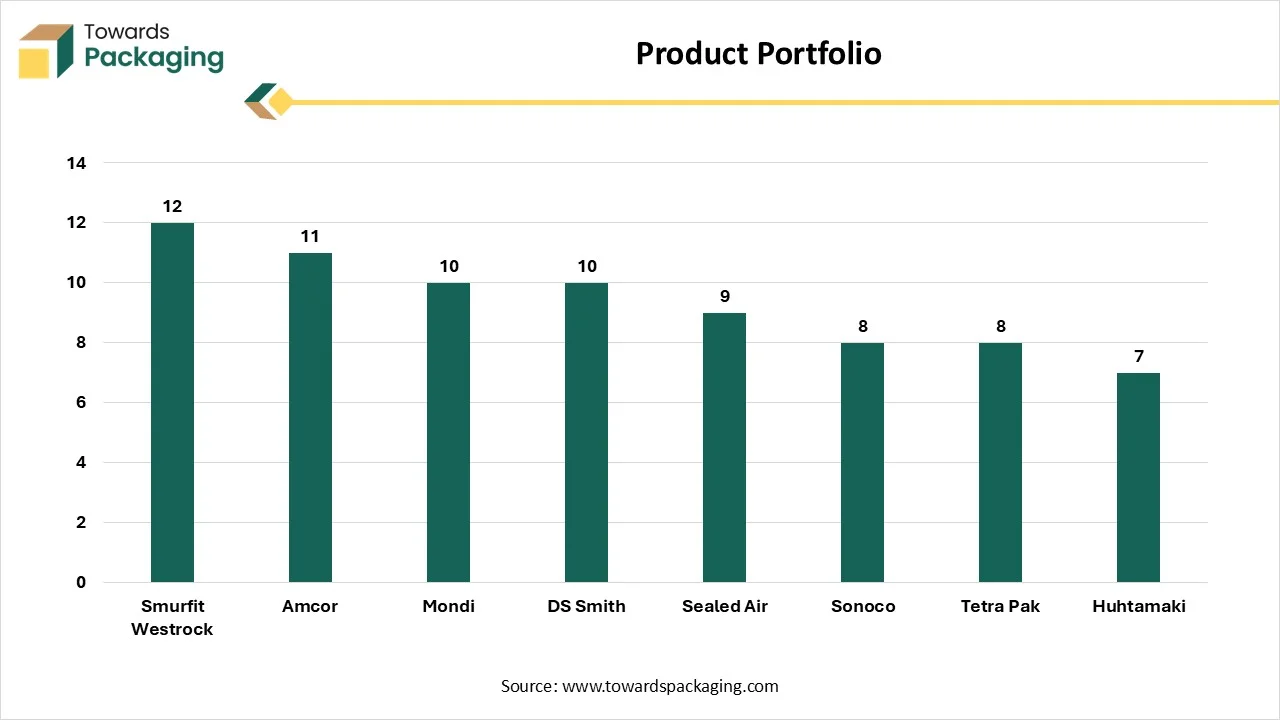
| Company | Service Portfolio |
| Smurfit Westrock |
Supply Chain Optimization Design Innovation Technical Testing Sustainability Consulting Automation |
| Amcor |
Amcor 360 Custom Design Studio Accelerate Graphics & Prepress ASSET Calibrate Technical Service & Support |
| Mondi |
ThinkBox by Mondi In-House Design Network Automation Services for eCommerce Mondi Performance Lab Co-Packing Services |
| DS Smith |
Supply Chain Analysis Customer Collaboration DISCS Testing Waste Management Performance Optimization End-of-Line Consulting |
| Sealed Air |
Package Design Digital Packaging Consultation Consumer Research Performance Testing Equipment Integration Sustainability |
| Sonoco |
Structural Design Supply Chain Performance Testing Circular Economy Consulting Technical Analysis |
| Tetra Pak |
Operational Performance Production Information Management Supply Chain Quality Management |
| Huhtamaki |
Pre-Press & Design Consultation Material Advisory Industrial Services Technical Services |
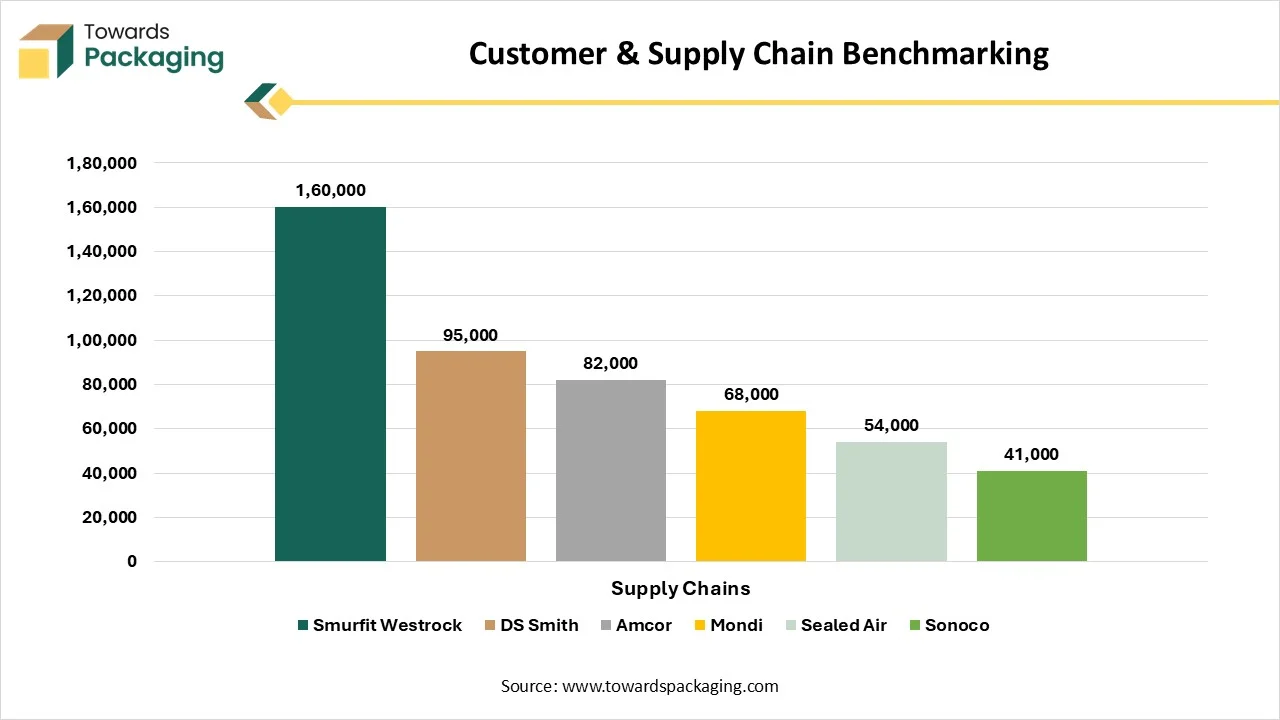
The supply chain of Smurfit Westrock is 160000. The supply chain focuses on forestry management, paper mills, packaging solutions, supply chain optimization, and recycling. The supply chain of DS Smith focuses on recycling, paper production, packaging design, and supply chain optimization. Amcor's supply chain focuses on procurement, R&D, manufacturing, distribution, and end markets. Mondi’s supply chain focuses on responsibly sourced materials, efficient production, conversion, distribution, and end-of-life. Sealed Air's supply chain includes raw materials, manufacturing, distribution, automation, and smart integration. Sonoco’s supply chain focuses on upstream sourcing, manufacturing conversion, downstream distribution, global services, and reverse logistics.
Service Demand
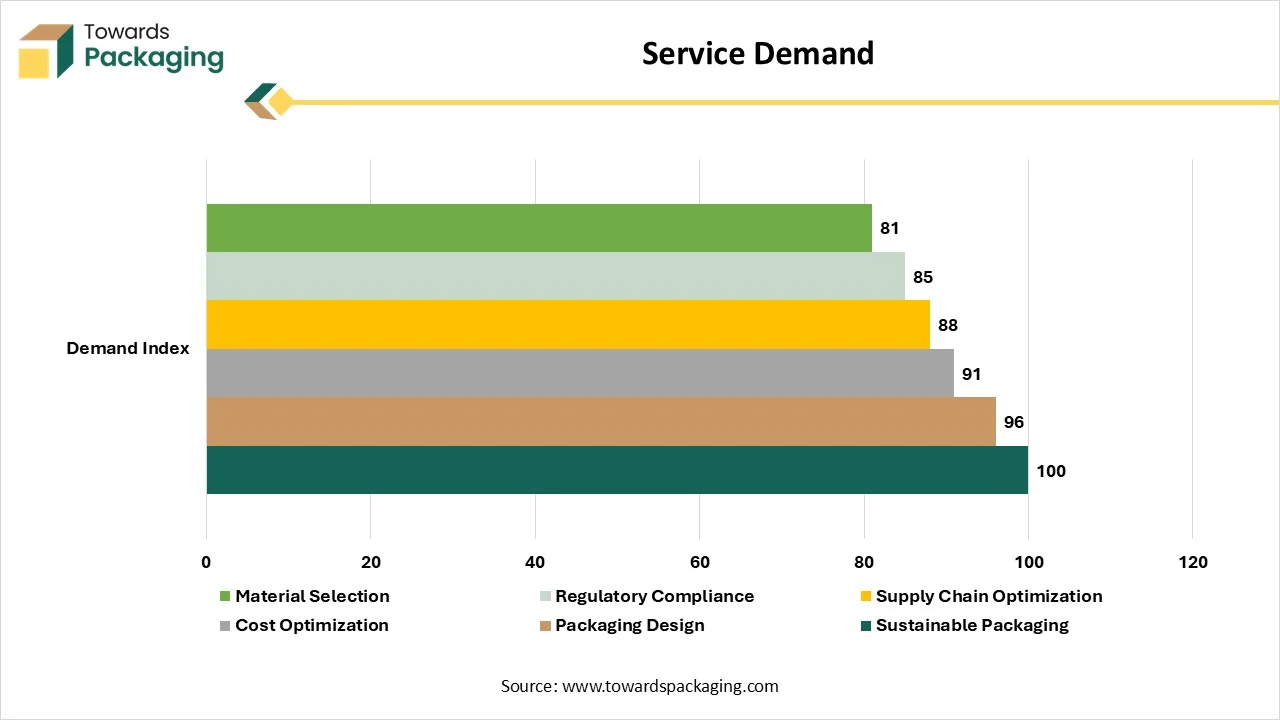
The sustainable packaging demand index is valued at 100. The sustainable packaging demand index is determined using legislative mandates, consumer behaviour, corporate commitments, technical performance, and raw material availability. The packaging design demand index is valued at 96. Factors like market shifts, seasonal spikes, material cost, standardization, and SKU expansion determine the demand index for packaging design. The cost optimization demand index is valued at 91. Cost optimization is determined using factors like feedstock volatility, fuel fluctuations, inventory constraints, dimensional metrics, and sustainability compliance. The supply chain optimization demand index is valued at 88. Factors like downstream product volume, packaging tier independence, supplier lead times, TCO, and many more determine the demand index. The regulatory compliance demand index is valued at 85. The regulatory compliance demand index is determined using factors like cross-border harmonization, EPR, and supply chain transparency. The material selection demand index is valued at 81 and is determined using factors like material cost, transport weight, tamper evidence, recyclability, storage volume, & barrier properties.
End-Use Demand
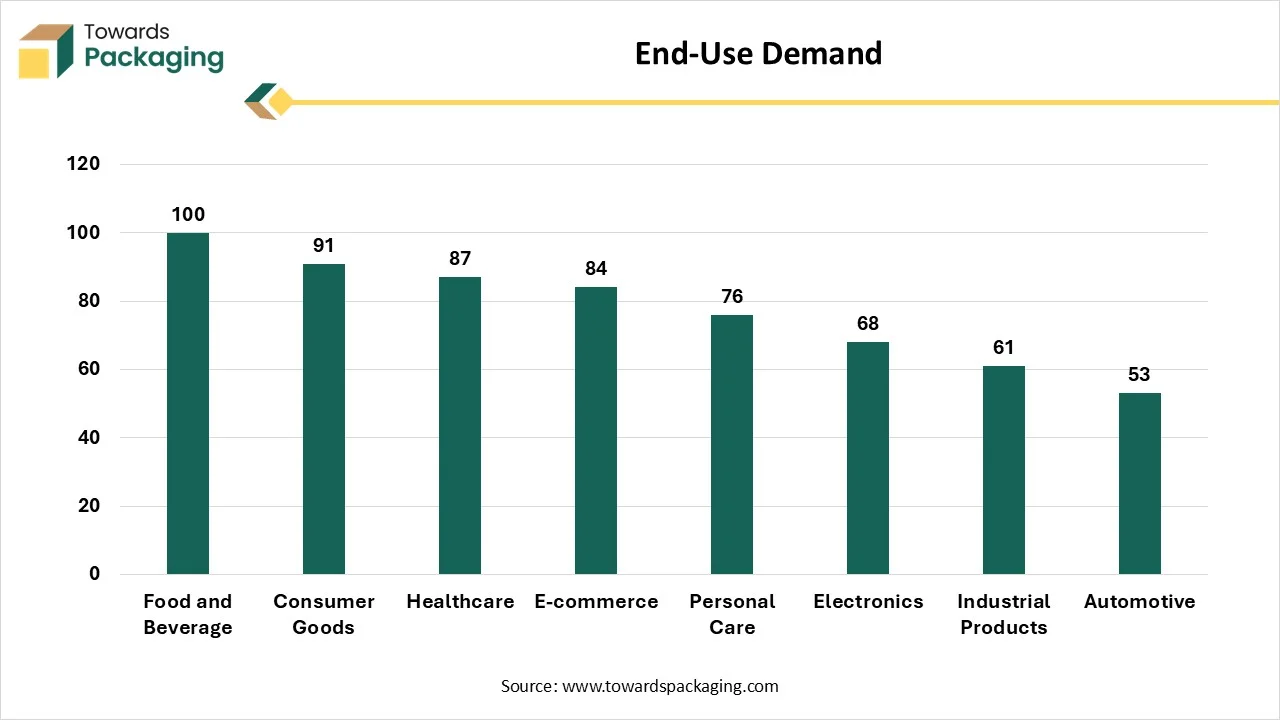
The food & beverage demand index is 100. The demand index is high due to the food revolution, delivery growth, and the need for on-the-go containers. The demand index for consumer goods is 91. The demand index is driven by high redesign of packaging, minimization of DIM costs, and impulse buying. The demand index for healthcare is 87. The healthcare demand index is driven by advanced medicines, tamper seals, online medicine shipping, and the use of tamper seals. The demand index for e-commerce is 84, driven by demand for supply chain protection. The demand index for personal care is 76 due to a rise in organic product portfolio and protection of delicate formulations. The Demand index for electronics is 68, driven by complex electronics architectures and decentralized manufacturing footprints. The demand index for industrial products is 61 due to the adoption of IoT tracking devices and a rise in automation-compatible packaging. The demand index for automotive is 53 due to JIT vehicle manufacturing and the EV transition.
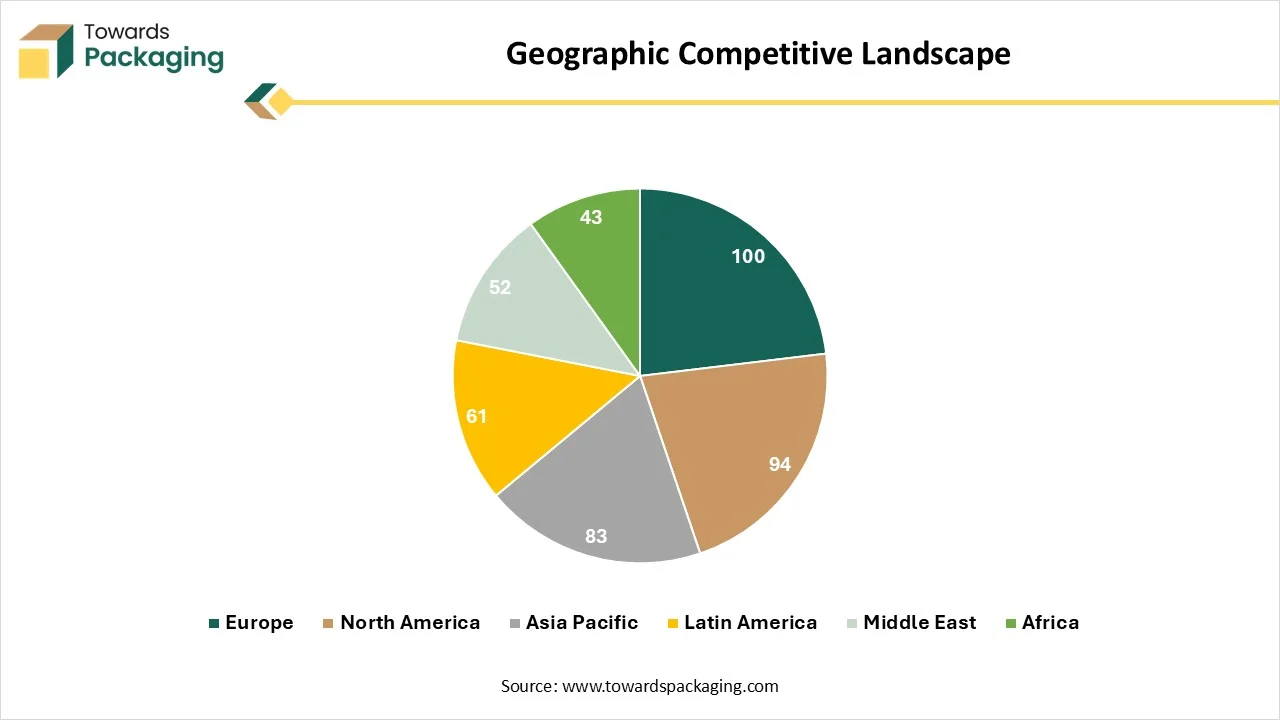
| Region | Leading Packaging Consulting |
| Europe |
Berndt+Partner L.E.K Consulting PreZero Packaging McKinsey & Company Intertek |
| North America |
PTIS, LLC Smithers McKinsey & Company Berlin Packaging BoldtSmith Packaging Consultant |
| Asia Pacific |
Interyek Group D&V Business Consulting L.E.K. Consulting FlowPal Asia Consulting |
| Latin America |
Midas Consulting Amcor Design Studio Atlantic Packaging Smurfit WestRock |
| Middle East |
Ollen Group Miebach Consulting AAB Industries Huhtamaki |
| Africa |
Packwise Pacteron AMENA Africa Packenger Packaging Consultants |
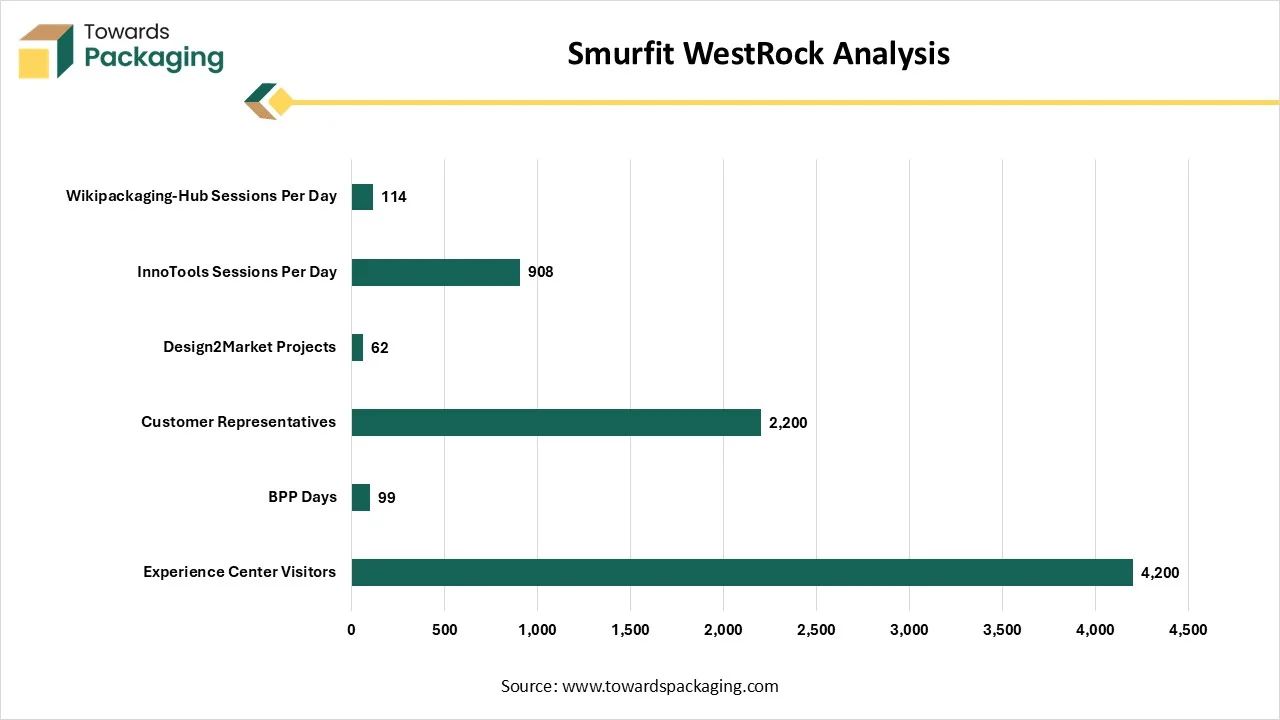
The total visitors to the Smurfit WestRock experience center is 4200. Visitors explored retail solutions, analyzed trends, and attended BPP days. The company hosted a total of 99 BPP days in the whole year across the globe. BPP days focus on advanced regional engagement, a collaborative platform, and showcasing sustainable solutions. The company connected with a total of 200 customer representatives. They designed 62 Designed2Market projects and hosted 908 sessions of InnoTools per day. They also hosted 114 sessions per day of Wikipackaging-hub sessions.
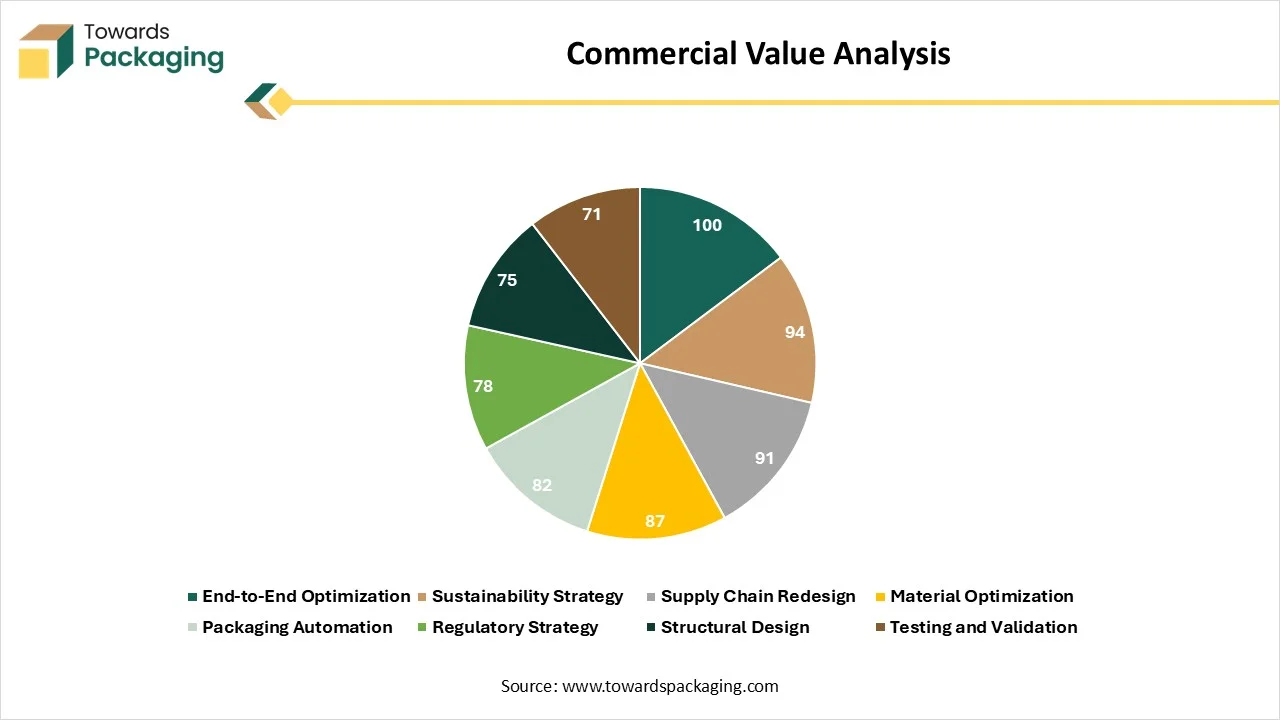
The commercial value index for end-to-end optimization is 100 due to high space utilization, damage mitigation, and production efficiency. The commercial value index for sustainability strategy is 94 due to brand trust, cost reductions, and investor attraction. The commercial value index for supply chain redesign is 91 due to transport optimization and loss reduction. The commercial value index for material optimization is 87 due to direct material savings and lowering return ratios. The commercial value index for packaging automation is 82 due to labor efficiency and high throughput. The commercial value index for regulatory strategy is 78 due to ESG targets and proactive product design. The commercial value index for structural design is 75 due to shelf differentiation and enhancing user experience. The commercial value index for testing & validation is 71 due to high failure cost and the need for specialized laboratories.
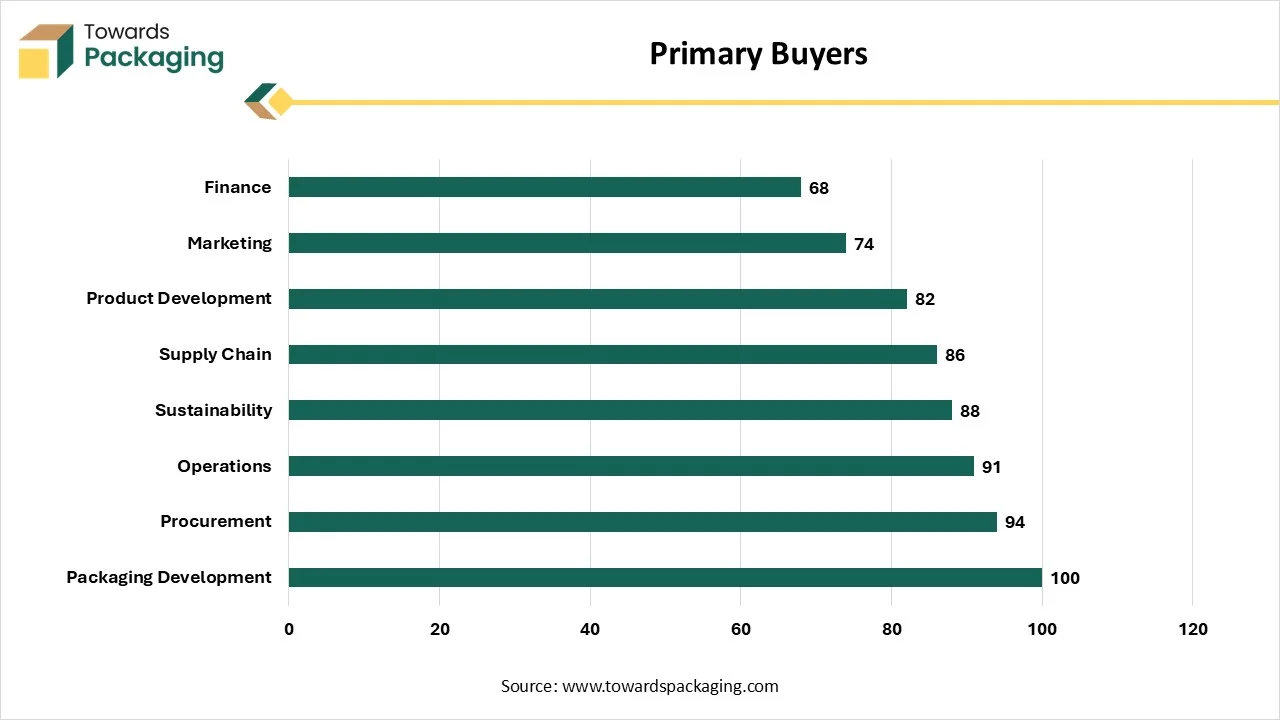
Primary Buyers
Provider Selection
The importance index of technical expertise is 100, driven by barrier optimization, advanced supply chains, and automation integration. The importance index of cost reduction potential is 96, driven by direct margin impact and minor optimization in packaging. The importance index of sustainability knowledge is 93 due to exploding regulatory compliance and retailers' focus on integrity of supply chains. The importance index of industry experience is 91 due to the strong sourcing networks, liability protection, and damage reduction. The importance index of supply chain expertise is 88 due to material handling efficiency and cube utilization. The importance index of innovation capability is 85, driven by consumer branding and eco-friendly demands. The importance index of regulatory knowledge is 82 due to expensive product recalls and medical packaging integrity requirements. The importance index of geographic coverage is 76 due to changing regional regulations and varying cultural expectations.
Buyer Problems
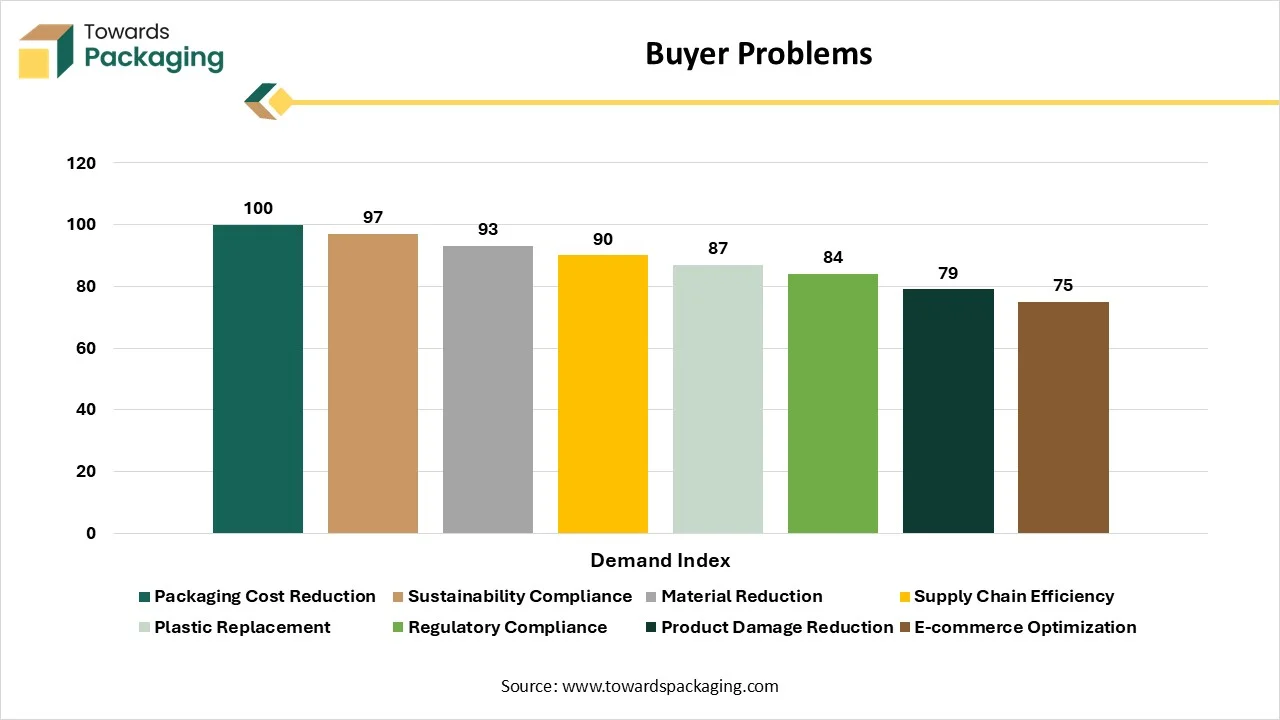
The demand index for packaging cost reduction is 100. The packaging cost reduction is growing due to tariff volatility, hidden operational costs, and diversified internal ownership. The demand index for sustainability compliance is 97. The sustainability compliance is growing due to consumer demand for sustainability claims and navigation of eco-designs. The demand index for material reduction is 93. The material reduction is growing due to increasing freight costs and recycled content shortages. The demand index for supply chain efficiency is 90 due to air shipping penalties and inventory pressures. The demand index for plastic replacement is 87 due to brands' commitments and technical complexity. The demand index for regulatory compliance is 84 due to a rise in chemical bans and high-stakes traceability in industries. The demand index for product damage reduction is 79 due to the high replacement costs and negative consumer reviews. The demand index for e-commerce optimization is 75 due to dimensional weight pricing and trending warehouse automation.
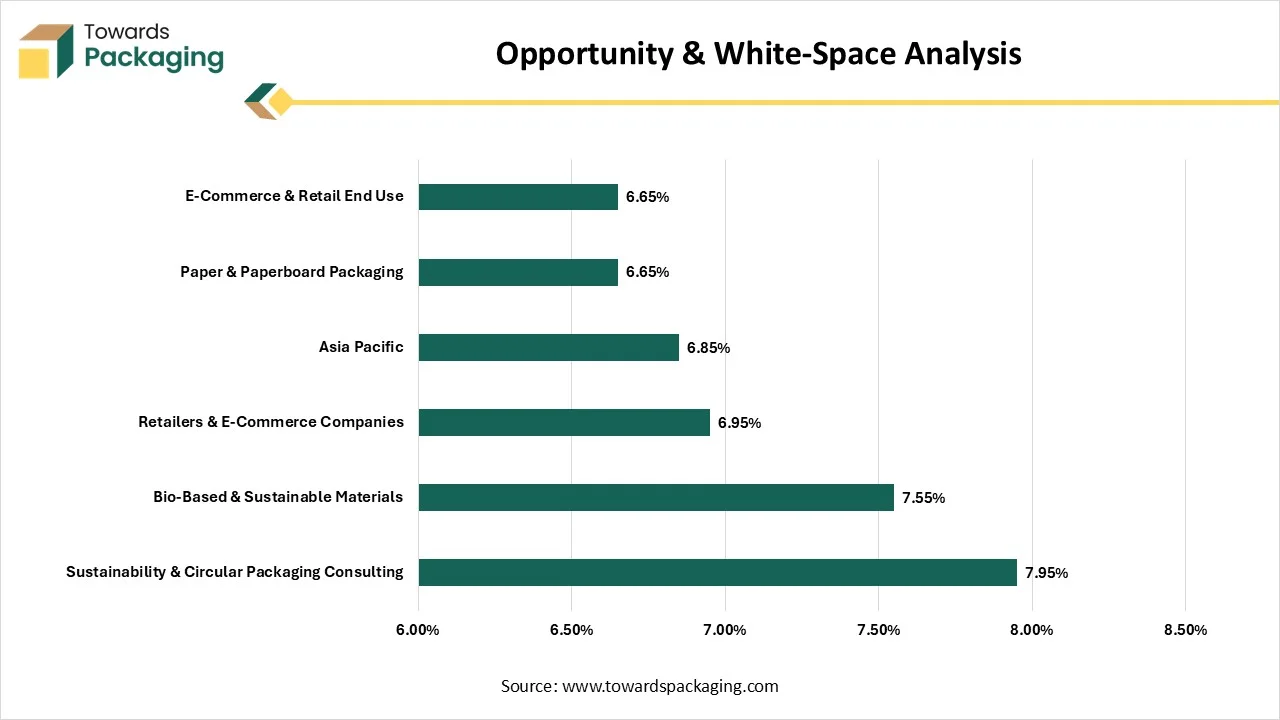
The sustainability and circular packaging consulting is expected to grow at a 7.95% CAGR during the forecast period due to the focus on bridging the green gap and bio-based plastics adoption. The bio-based & sustainable materials are expected to grow at a 7.55% CAGR during the forecast period, driven by demand for a low carbon footprint and the circular economy. The retailers & e-commerce companies are expected to grow at a 6.95% CAGR during the forecast period, driven by demand for minimizing last-mile delivery expenses and the development of durable secondary packaging. Asia Pacific is predicted to grow at a CAGR of 6.85% during the forecast period, driven by retail boom, industrialization, and advancements in smart technology. Paper & paperboard packaging is predicted to grow at a CAGR of 6.65% during the forecast period due to increased penalties and heightened environmental awareness. E-commerce & retail end-use is predicted to grow at a CAGR of 6.65% during the forecast period due to the rise in new retail models and focus on saving warehouse space.
|
Future Growth Indicator
|
Direction
|
|
Sustainability Consulting
|
High Growth
|
|
Circular Packaging
|
High Growth
|
|
Bio-Based Materials
|
High Growth
|
|
Paper & Paperboard
|
Strong Growth
|
|
E-Commerce Consulting
|
Strong Growth
|
|
SME Adoption
|
Strong Growth
|
|
Asia Pacific
|
Fast Regional Growth
|
|
Traditional Plastic Consulting
|
Moderate Growth
|
Sustainability consulting is exhibiting high growth in the future. Sustainability consulting is growing due to changing consumer packaging demand, cost pressures, government rules, and avoidance of greenwashing. Circular packaging is expected to show high growth in the future due to shoppers preferring eco-friendly brands, focus on reusing materials, and innovative sorting tools. Bio-based materials are expected to show high growth in the future due to the growing environmental concerns of traditional materials, preference for renewable resources, and green packaging. Paper & paperboard is exhibiting strong growth in the future due to the demand for low environmental waste, smooth branding, and development of paper-based food packaging. E-commerce consulting is showcasing strong growth in the forecast period due to complex shipment transit, increasing return rates, and the need to lower expensive shipping costs. SME adoption is exhibiting strong growth in the future due to the demand for transit-friendly packaging and high technological access. Asia Pacific is expanding rapidly across regions due to higher interest in expert planning, expanding digital tools, and demand for stronger boxes. Traditional plastic consulting is exhibiting moderate growth due to the rise in specialty expertise, urbanization, and growing sustainability frameworks.
According to my research, the global packaging consulting market is growing at a notable rate. The demand for sustainable packaging, e-commerce, material optimization, complex global rules, and technological advancements drive the market growth. Packaging design & development held a major share of 24.35% in the market in 2025. Packaging manufacturers held a leading share of 29.60% in the market in 2025. Players like Smithers, Amcor, Sealed Air Corporation, PTIS, LLC, and Smurfit WestRock support the growth.
Vidyesh Swar worked on the packaging consulting market overview, forecast value, regional share, and comprehensive segmental overview.
Aman worked on the leading companies' competitive landscape, service portfolio, supply chains, demand analysis, geographic landscape, commercial value analysis, and buyer intelligence.
Aditi verified findings, maintained quality standards, corrected document errors, and reviewed the entire document.
By Service Type
By Packaging Type
By Material
By End-Use Industry
By Client Type
By Organization Size
By Region
























Principal Research Analyst
Vidyesh Swar is a Senior Research Analyst at Towards Packaging, bringing over 4 years of dedicated expertise in market intelligence and strategic analysis across the dynamic world of packaging technologies and solutions.
Learn more about Vidyesh Swar

Reviewed By
Aditi Shivarkar, with 14+ years in packaging market research, specializes in food, beverage, and eco-friendly packaging. She ensures accurate, actionable insights, driving Towards Packaging Analytics & Consulting 's excellence in industry trends and sustainability.
Learn more about Aditi Shivarkar

Packaging Consulting Market
 Table of Content

 Download Sample
 Schedule a Meeting