The U.S. Beverage Packaging Market is comprehensively analyzed with detailed insights into market size, year-on-year growth rates, and segment-wise performance across packaging types and materials. The report presents in-depth regional data covering North America, Europe, APAC, Latin America, and the Middle East & Africa, along with competitive analysis of key companies. It further includes value chain evaluation, trade statistics, and extensive manufacturer and supplier data, backed by verified quantitative metrics and statistical models.
| Packaging Type | Annual Production (Units) |
| PET Bottles | 135 billion |
| Aluminum Cans | 110 billion |
| Glass Bottles | 28 billion |
| Cartons | 14 billion |
| Pouches | 4.8 billion |
In the U.S. beverage packaging market, PET bottles lead production with 135 billion units annually, reflecting their widespread use in soft drinks, water, and juices due to their lightweight and recyclable nature. Aluminum cans followed closely with 110 billion units, favored for their durability and growing demand in carbonated beverages. Glass bottles account for 28 billion units, typically used for premium beverages and craft drinks, where quality perception is crucial. Cartons reached 14 billion units, mainly for juices and dairy, offering convenience and sustainability benefits. Flexible pouches, though smaller at 4.8 billion units, are gaining traction for on-the-go drinks and single-serve packaging, driven by consumer preference for lightweight and portable options.
Beverage packaging market (U.S.): packaging materials, formats, closures, processes and related channel/functional segments used to contain, protect, preserve, transport and market non-alcoholic and alcoholic beverages throughout the supply chain from primary package in contact with the beverage through secondary and tertiary packaging.
E-commerce growth is significantly boosting the U.S. beverage packaging market, driven by an increase in direct-to-consumer beverage deliveries and online grocery sales. To lessen transit damage, brands are increasingly using lightweight, sturdy, and spill-resistant packaging like PET bottles and aluminum cans. To support last-mile logistics efficiency, there is a growing demand for packaging formats that are recyclable, compact, and easy to stack. Packaging innovation is therefore increasingly in line with sustainability and e-commerce fulfillment needs.
The U.S. beverage packaging market, sustainability, and compliance are heavily impacted by stricter state and federal recycling laws, carbon disclosure requirements, and plastics regulations. To meet emission circularity and landfill reduction goals, brands are shifting toward recyclable aluminum cans, returnable bottles, rPET compostable coatings, and lightweight containers. Bottle bills, FDA packaging safety regulations, extended producer responsibility guidelines, and PFAS-free regulations are the main forces behind compliance. To demonstrate their carbon neutrality claims, major beverage companies are investing in energy-efficient operations, refillable packaging pilots, and closed-loop collection ecosystems. Consumer demand for transparent, eco-friendly, and ethically sourced packaging across retail and on-premise channels is another factor driving this change.
The industry is also seeing greater focus on label simplification to improve sorting and recycling efficiency. Companies are testing plant-based packaging materials to reduce dependence on fossil fuels. Large brands are partnering with municipalities to strengthen local collection infrastructure. Investments in digital tracking and smart label technologies are enabling better traceability and regulatory compliance.
| Category | Imports (US$ Mn) | Exports (US$ Mn) |
| PET Bottles | 620 | 410 |
| Aluminum Cans/Sheets | 2,450 | 980 |
| Glass Bottles | 1,150 | 740 |
| Paper Cartons | 320 | 180 |
In the U.S. beverage packaging market, aluminum cans and sheets account for the highest trade value, with imports of US$2,450 million and exports of US$980 million, highlighting strong reliance on global aluminum supply chains. Glass bottles also show significant trade activity driven by demand from alcoholic and premium beverage segments. PET bottles record moderate imports and exports, reflecting steady usage in bottled water and soft drinks. Paper cartons remain in a smaller segment, primarily serving niche and sustainable packaging applications.
The integration of AI technology in the U.S. beverage packaging market plays a significant role in the inspection of quality and production of leakage-proof packaging. With AI it becomes easy to add complete details of the beverages to meet the demand of the consumers who are health-conscious. It allows brands to provide limited-edition or customized designs for packaging to serve multiple purposes. Advanced technology help in gathering information that can upgrade marketing strategies and help in its expansion.
")
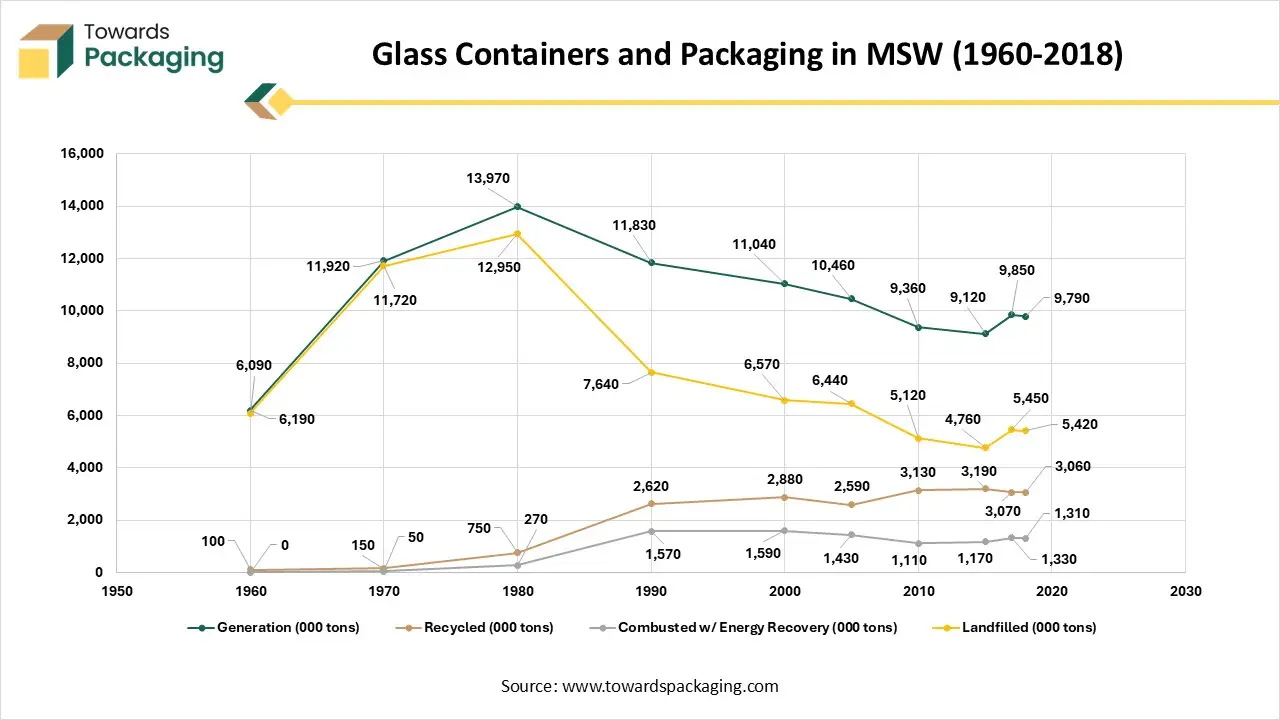
Glass packaging includes bottles and jars for beverages, food, cosmetics, and other consumer goods. Over the decades, the amount of glass packaging waste generated in the U.S. has fluctuated. Generation peaked around 1980 (nearly 14 million tons) before gradually decreasing as lighter packaging options emerged and recycling increased.
Recycling has improved significantly from only 100,000 tons in 1960 to more than 3 million tons in 2018, representing 31.3% of all glass generated. However, most glass still ends up in landfills because it is heavy, costly to transport, and often contaminated in single-stream recycling systems.
")
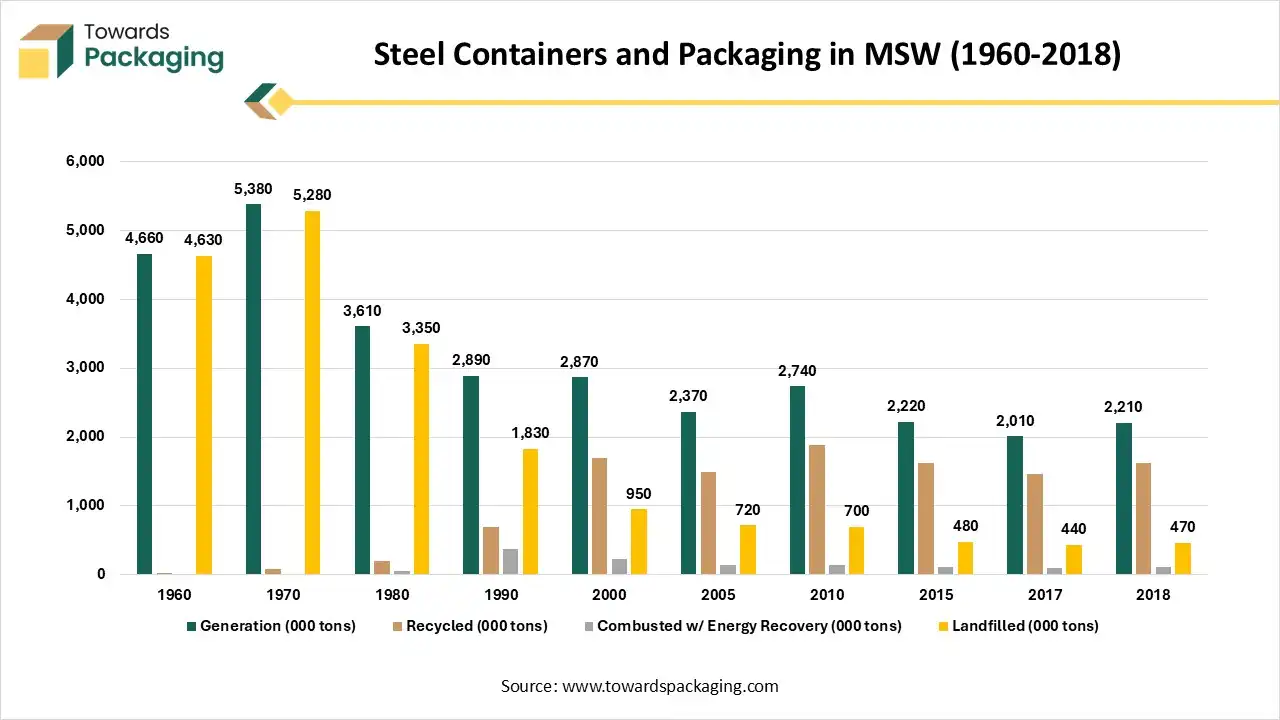
Steel packaging includes food cans, aerosol cans, steel strapping, and large industrial drums. In the 1960s and 70s, more steel cans were used, but over time, lighter alternatives (like aluminum and plastics) reduced steel packaging volume. As a result, generation fell from 4.66 million tons in 1960 to around 2.2 million tons in 2018.
")
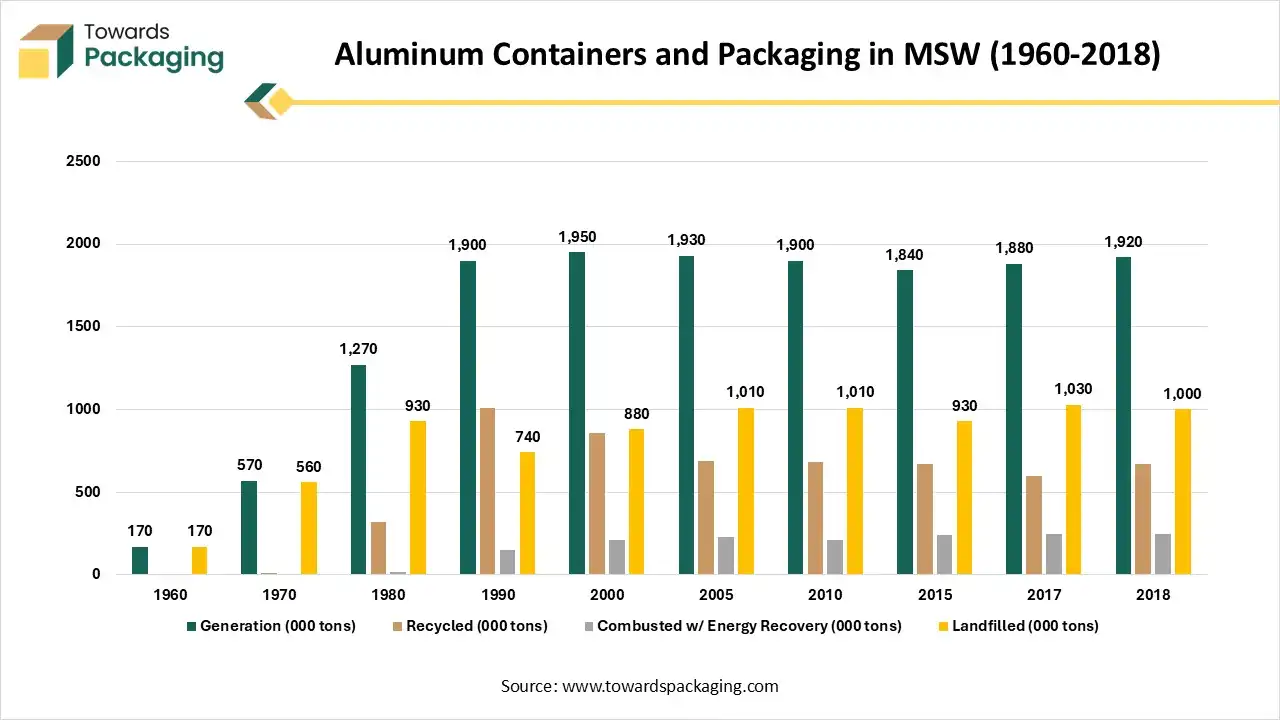
Aluminum packaging mainly beverage cans, foil, and closures grew from very small amounts in 1960 to about 1.9 million tons in 2018. Recycling improved over time, reaching about 670,000 tons in 2018, or 50% of total generation, mostly from beverage cans. Around 13% of aluminum packaging was burned for energy, while just over half was landfilled. Overall, aluminum packaging use has remained steady in recent years, with moderate recycling rates limited mainly by non-can aluminum products like foil and flexible packaging.
The increasing demand for energy drinks consumption among consumers has driven the U.S. beverage packaging market to grow significantly. Enhancing the delivery process with improved packages which help in transportation of beverages. The rising concern of consumers towards health has boosted the demand for eco-friendly packaging. Major factors behind the growth of this market are rapid urbanization, growing e-commerce sector, and changing lifestyle of people.
The increasing production costs and low profit has restraint the U.S. beverage packaging market. There is a continuous change in the raw material charges which restrain the scope of expansion of this industry. With low profit margin and high-risk factor low scale business face hurdle in growth which limit the development of the market.
The continuous innovation in the packaging process has raised the opportunities for the U.S. beverage packaging market. Increasing demand for ready-to-drink beverages, functional beverages, and sports beverages has pushed the market to introduce advanced level packaging which enhanced the adoption of this market. Enhancement in the materials used to provide high barrier packaging film which enhance the self-life of the products and influence the growth of the market. Incorporating automation in the packaging production process to meet the huge demand of the market and enhance reliability promote this market to develop significantly.

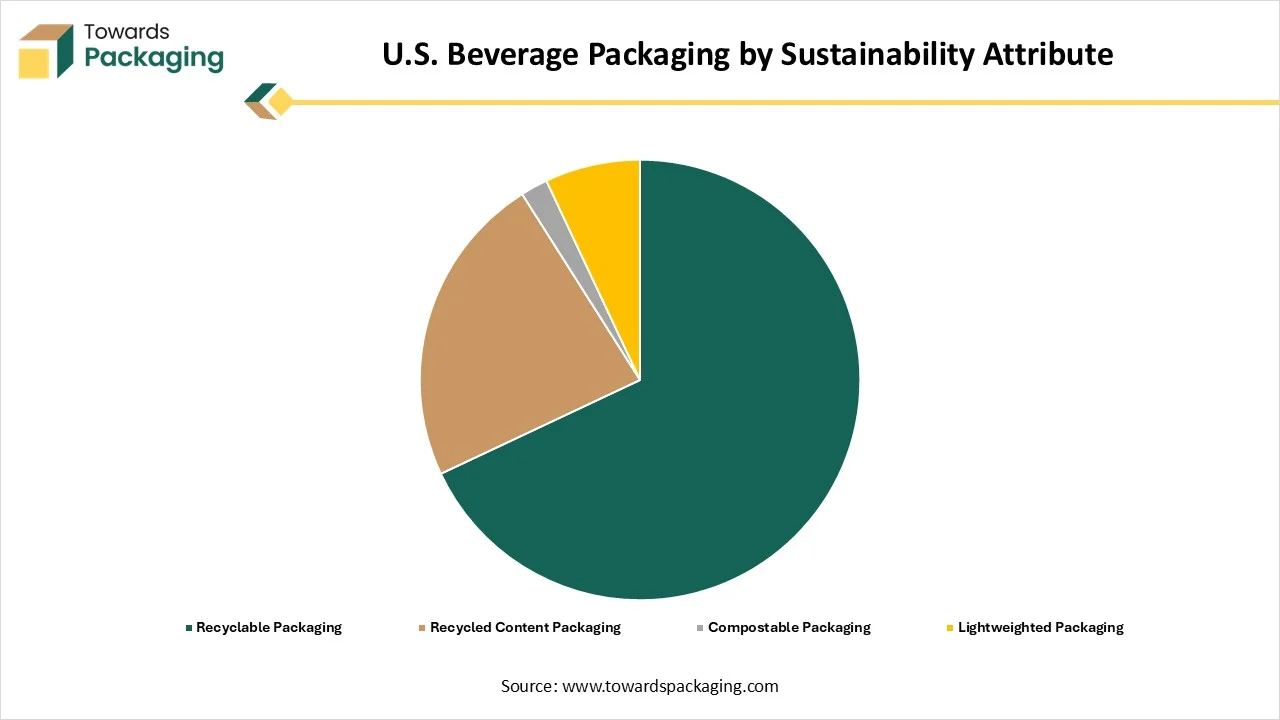
| Attribute | % Share |
| Recyclable Packaging | 68% |
| Recycled Content Packaging | 23% |
| Compostable Packaging | 2% |
| Lightweighted Packaging | 7% |
In the U.S. beverage packaging market, recyclable packaging leads sustainability adoption with a 68% share, supported by well-established recycling systems and regulatory push. Recycled content packaging accounts for 23%, as beverage brands increasingly incorporate post-consumer recycled materials to meet circular economy targets. Lightweight packaging, holding 7%, reflects efforts to reduce material consumption and logistics-related carbon emissions. Meanwhile, compostable packaging remains niche at 2% due to limited industrial composting infrastructure. Overall, sustainability strategies in U.S. beverage packaging are strongly centered on recyclability and recycled content solutions.
")
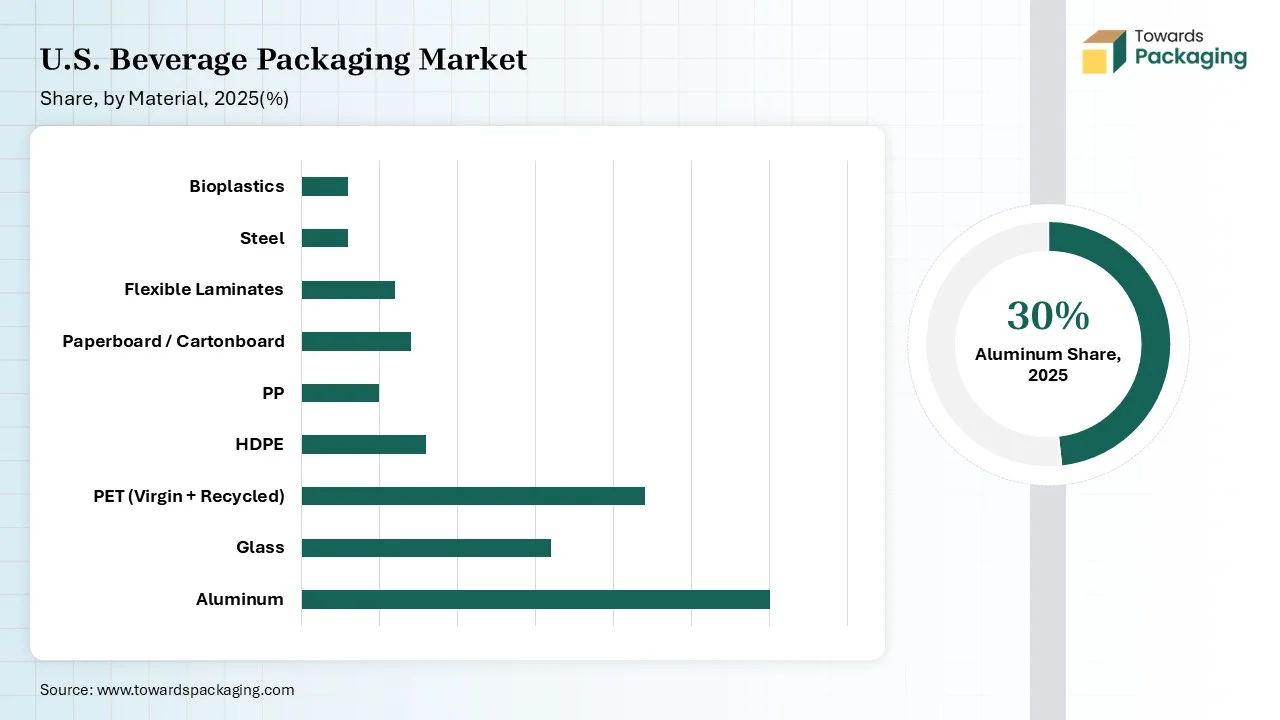
The aluminum segment dominated the U.S. beverage packaging market in 2025 due to its lightweight, durable, and sustainable nature. It works as excellent barrier from heat, moisture, light, and air. These aluminum cans are widely used for packaging of alcohol and soft drinks. The rising concern for ecological issues has promoted the growth of this segment. The major market players available in the U.S. for beverage packaging are Coca-Cola and PepsiCo, promoting the usage of this material extensively.
The PET (Recycled PET/rPET) segment is expected to grow at the fastest rate in the market during the forecast period of 2026 to 2035. It is due to presence of strict guidelines, increasing investment for recycling infrastructures, and rising consumers’ demand. The rising adoption for eco-friendly packaging or recyclable packaging for beverages boost the demand for this segment. Huge investment in the chemical recycling infrastructure has promoted the adoption of this segment to grow rapidly.
The bottled water segment held the largest share of the U.S. beverage packaging market in 2025 due to rising concern towards health, functional water products, and convenience. The growing search for convenient option to maintain the hydration required in the body has raised the demand for this segment. Increasing production of bottled water with innovative bottle materials and designs to meet the demand of the consumers boost development of this sector. There is a huge demand for portable single-serve water bottles for efficient packaging has influenced the demand for this segment.
The functional & nutraceutical beverages segment is expected to grow at the fastest rate in the market during the forecast period of 2026 to 2035. This segment is growing rapidly due to increasing demand for wellness and healthcare beverages. It ensures the safety of the product and maintain its integrity. Increasing demand for smart packaging such as integration of NFC tags has boosted the demand for this segment.
")
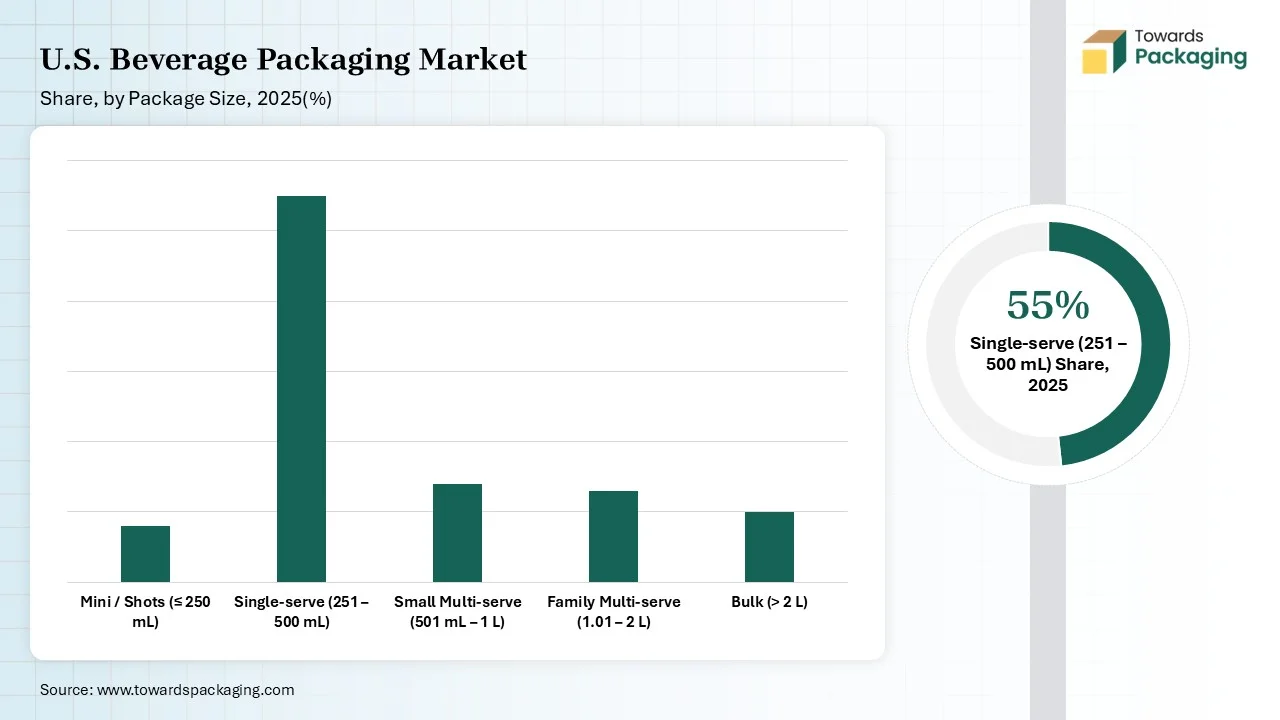
The single-serve (251–500 mL) segment held the largest share of the U.S. beverage packaging market in 2025 due to rising demand for portable and convenient packaging. This segment is majorly driven by ready-to-drink beverages, and bottled water. Increasing demand for smart and eco-friendly packaging has influenced the demand of this segment. Presence of major market players in the U.S. has played a significant role in extending the demand for segment.
The Mini/Shots (≤ 250 mL) segment is expected to grow at the fastest rate in the market during the forecast period of 2026 to 2035. This segment is growing due to enhanced consumers concern for health and portion control capacity. It is highly convenient and functionally appropriate packaging. Changing lifestyle and growing urbanization has fuelled the demand for this segment.
The cold-fill (including carbonation-stable) segment held the largest share of the U.S. beverage packaging market in 2025 due to high consumers demand and regulatory guidelines has influenced the demand for this segment. These are lightweight and recycled PET which is growing because of rising eco-friendly options availability. It covers a huge variety of beverages such as bottled water, energy drink, soft drink, juices, and various other. It is extensively accepted due to the high capacity to preserve the quality and flavour of the drinks.
The Aseptic-fill segment is expected to grow at the fastest rate in the market during the forecast period of 2026 to 2035. This segment is increasing significantly due to rising concern to protect the quality of the beverages. This process helps in maintaining the taste, quality, and nutritional value of the beverages for prolonged period. It helps in extending the shelf life of the beverages at room temperature.
")
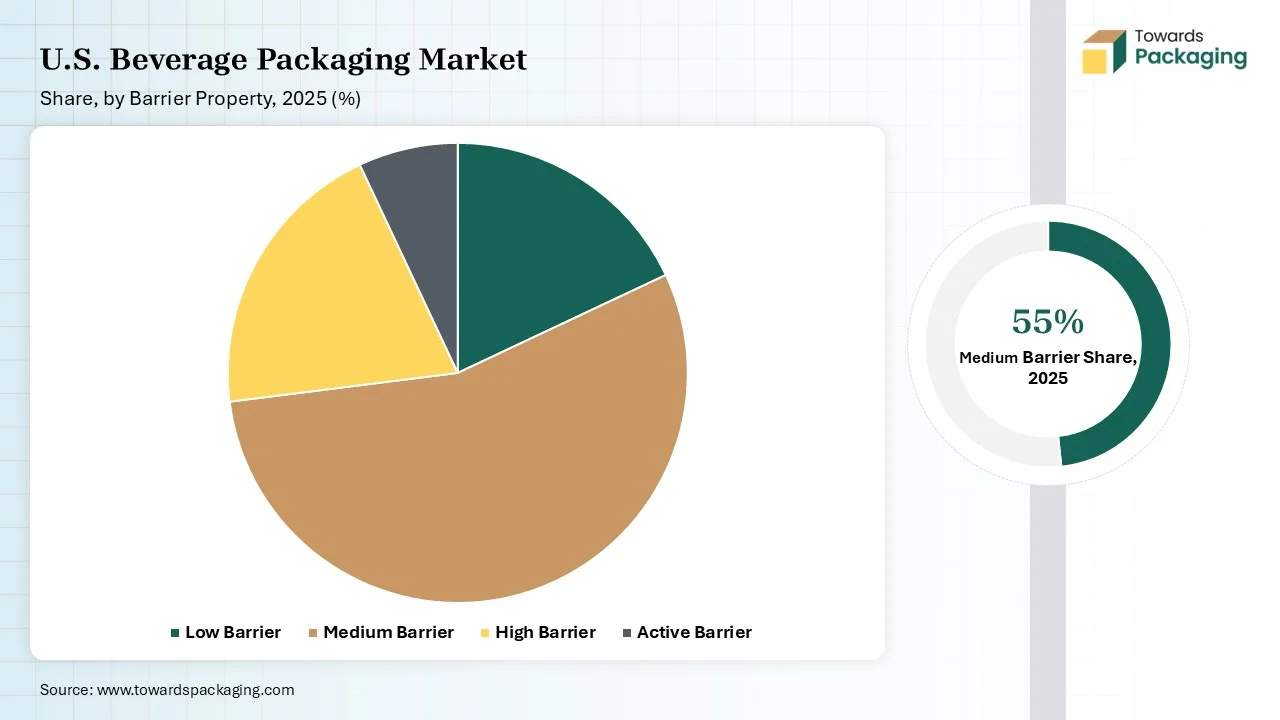
The medium barrier segment held the largest share of the U.S. beverage packaging market in 2025 due to growing acceptance for functional beverages. It provides moderate protection from external agents such as light, air, moisture, and other ecological factors. These medium barrier resources are majorly multi layered by combining various materials together. These cartons are mainly made up of paperboard combined with thin layers of aluminum and plastics.
The high barrier segment is expected to grow at the fastest rate in the market during the forecast period of 2026 to 2035. This segment is increasing significantly due to rising demand for sustainable packaging with extended shelf-life. This segment support in extension of shelf life of the product by blocking light, air, and moisture. There is a huge demand for pouches and resealable packages which promote this segment with enhanced materials utilization.
The South U.S. held the largest share of the U.S. beverage packaging market in 2025, due to the increasing focus towards convenient packaging of the beverages. This region is growing rapidly because of the presence of huge variety, convenience, and its functionality. The rising trend for cans, pouches, and small bottles has influenced the demand for beverage packaging with unique design packages. Evolving packaging guidelines and consumer preferences has boosted the market to grow rapidly in this region.
West U.S. expects the significant growth in the U.S. beverage packaging market during the forecast period. This market is growing in this region rapidly due to huge production of sustainable packaging for storage and transportation of a wide range of beverages. The rising demand for functional and plant-based beverages packages has pushed the market development.

Tier 1
Tier 2
Tier 3
By Material 
By Beverage Category (End-use Application)
By Package Size
By Filling / Processing Technology
By Barrier Property

Principal Research Analyst
Vidyesh Swar is a Senior Research Analyst at Towards Packaging, bringing over 4 years of dedicated expertise in market intelligence and strategic analysis across the dynamic world of packaging technologies and solutions.
Learn more about Vidyesh Swar
Reviewed By
Aditi Shivarkar, with 14+ years in packaging market research, specializes in food, beverage, and eco-friendly packaging. She ensures accurate, actionable insights, driving Towards Packaging Analytics & Consulting 's excellence in industry trends and sustainability.
Learn more about Aditi ShivarkarU.S. Beverage Packaging Market